Abstract
Hepatocellular carcinoma (HCC) is one of the most common malignant tumors with high mortality worldwide, which is characterized by aggressive growth and metastasis. However, the relationship between TOP2A and CDC6 and HCC remains unclear. GSE121248 and GSE101728 profiles for liver cancer were downloaded from the gene expression omnibus database generated using GPL21047and GPL570. Differentially expressed genes (DEGs) were screened and weighted gene co-expression network analysis was performed. The construction and analysis of protein–protein interaction network, functional enrichment analysis, gene set enrichment analysis. Gene expression heat map was drawn and survival analysis was performed. Comparative toxicogenomics database analysis were performed to find the disease most related to the core gene. TargetScan was used to screen miRNAs regulating central DEGs. 885 DEGs were identified. According to gene ontology analysis, they were mainly enriched in organic acid metabolism process, metabolic pathway, p53 signal pathway and PPAR signal pathway. The enrichment items are similar to the GOKEGG enrichment items of differentially expressed genes, mainly in the process of organic acid metabolism, p53 signal pathway and PPAR signal pathway. In the enrichment project of metascape, gene ontology has PIDPLK1 pathway, mitotic cell cycle, tumor retinoblastoma gene. The construction and analysis of protein-protein interaction network obtained 10 core genes (TOP2A, CDK1, ASPM, RACGAP1, ZWINT, CDC6, AURKA, NCAPG, BUB1B, CCNB1), and found that these core genes were highly expressed in tumor tissues and low in normal tissues. Comparative toxicogenomics database analysis showed that 10 genes (TOP2A, CDK1, ASPM, RACGAP1, ZWINT, CDC6, AURKA, NCAPG, BUB1B, CCNB1) were related to necrosis, inflammation, HCC, liver cirrhosis, and adenoid cystic carcinoma. TOP2A and CDC6 are highly expressed in liver cancer, which may become molecular targets for early diagnosis and precise treatment.
Keywords: CDC6, liver cancer, prognosis, TOP2A
1. Introduction
Liver cancer is a fatal malignant tumor with significant histological and biological heterogeneity, which is the fourth leading cause of cancer-related death in the world.[1] As a result, it has become a major public health challenge. According to Global Cancer Statistics report,[2] 841,080 cases of liver cancer were reported worldwide in 2018, accounting for 4.7% of the total cancer cases in the same period, and 781,631 deaths, accounting for 8.2% of the total cancer deaths. According to annual forecasts, the World Health Organization estimates that 1,276,679 patients will die of liver cancer by 2040.[3] Hepatocellular carcinoma (HCC), the most common liver cancer, is a major cancer in the world.[4] Its incidence is on the rise and is closely related to advanced liver disease. Liver cirrhosis is the biggest risk factor of this malignant tumor and is the main indicator of screening and surveillance.[5] HCC can be diagnosed frequently and uniquely through multiphase imaging based on cross-sectional imaging without the need for rigorous tissue sampling.[6] Despite advances in medical, regional and surgical treatment, HCC remains one of the most common causes of cancer-related deaths worldwide.[7] Therefore, we continue to seek improvements in screening, diagnosis and treatment strategies to improve the prognosis of this malignant tumor. The identification of biomarkers useful for monitoring and early HCC diagnosis is still lacking, although cutoff points vary, and available biomarkers show low sensitivity and heterogeneity specificity, even in longitudinal evaluation or binding of biomarkers.[8–12] The etiology and biomarkers of liver cancer are not clear. The disease may be related to genetic factors, chromosome abnormalities, gene fusion and other factors. Therefore, in-depth study of the molecular mechanism of liver cancer is particularly important.
As an important part of the development of life science, bioinformatics has been at the forefront of life science and technology research. In recent years, China biotechnology has developed by leaps and bounds, and bioinformation resources have also grown explosively. Bioinformatics reveals the biological significance represented by big data, which is a bridge between data and clinic. Represented by the analysis and reporting of gene detection data, bioinformatics plays an important role in tumor treatment.[13,14]
However, the relationship between TOP2A, CDC6 and liver cancer is not clear. There are no drugs currently on the market that may affect the targets identified in this study. It is useful to develop drugs based on the results of this study. Therefore, this paper intends to use bioinformatics technology to mine the core genes between HCC and normal tissues, and carry out enrichment analysis and pathway analysis. The public dataset was used to verify the significant role of TOP2A and CDC6 in liver cancer. And it was verified by basic cell experiment. The main purpose of this study is to explore the role of TOP2A and CDC6 in liver cancer and apply them to clinical practice to truly understand the disease and provide a new direction for the prevention and precision treatment of liver cancer.
2. Methods
2.1. Liver cancer data set
In this study, the liver cancer dataset GSE121248 and GSE101728 configuration files were downloaded from the gene expression omnibus database (http://www.ncbi.nlm.nih.gov/geo/) generated by GPL21047 and GPL570. GSE121248 included 70 liver cancer and 37 normal tissue samples, while GSE101728 included 7 liver cancer and 7 normal tissue samples. It is used to identify differentially expressed genes (DEGs) of HCC.
2.2. De-batch processing
For merging and debatching of multiple datasets, we first use R software package to merge datasets GSE121248 and GSE101728. For the merging of multiple data sets, we first use the R software package in Silico Merging (DOD: 10.1186/1471-2105-13335) to merge the data sets to get the merge matrix. Furthermore, we use the remove Batch Effect function of the R software package limma (version 3.42.2) to remove the batch effect, and finally obtain the matrix after removing the batch effect, and apply it to the follow-up analysis.
2.3. Screening of DEGs
R package “limma” is used for probe aggregation and background correction of the merge matrix of GSE121248 and GSE101728. The Benjamini–Hochberg method is used to adjust the original P value. The multiple change is calculated using the error detection rate (FDR). The cutoff standard of DEG is FDR < 0. 05. And make the volcano map, use the Wayne diagram to get the intersection DEGs.
2.4. Weighted gene co-expression network analysis (WGCNA)
First of all, we use the de-batch and post-merge matrix of GSE121248 and GSE101728 to calculate the median absolute deviation of each gene, eliminate the top 50% of the genes with the smallest median absolute deviation, use the good Samples Genes method of R package weighted gene co-expression network analysis (WGCNA) to remove the outlier genes and samples, and then use WGCNA to construct scale-free co-expression network. Specifically, first, Pearson correlation matrix and average linkage method are performed on all paired genes. And then using the power function a _ mn = | C_mn | ^β (C_mn = correlation between Pearson Gene m and Gene n, a _ mn = adjacent between Gene m and n) build weighted adjacency matrix. β is a soft threshold parameter, which can emphasize the strong correlation between genes and weaken the influence of weak correlation and negative correlation. After selecting the power of 10, the adjacency is transformed into a topological overlap matrix (TOM), which can measure the network connectivity of a gene. The network connectivity is defined as the sum of its adjacency with all other genes, which is used for the network gene ratio, and the corresponding dissimilarity degree (1-TOM) is calculated. In order to classify the genes with similar expression profiles into gene modules, the average linkage hierarchical clustering is carried out according to the dissimilarity measure based on TOM, and the minimum size (genome) of the gene tree is 30. Set the sensitivity to: 3. In order to further analyze the module, we calculate the difference of the feature genes of the module, select a cut line for the module tree, and merge some modules. In addition, we also merged the modules with a distance <0.25, and finally obtained 19 co-expression modules. It is worth noting that the gray module is considered to be a set of genes that can not be assigned to any module.
2.5. Construction and analysis of protein-protein interaction (PPI) Network
Search tool for the retrieval of interacting genes (STRING) aims to collect, score and integrate all publicly available sources of protein-protein interaction (PPI) information, and to supplement these sources by calculating predictions. In this study, the list of differential genes was input into STRING database to construct a PPI network for predicting core genes (confidence > 0.4). Cytoscape software can provide biologists with biological network analysis and 2-dimensional (2D) visualization. In this study, the PPI network formed by string database is visualized and core genes are predicted by Cytoscape software. First of all, we import the PPI network into the cytoscape software, find the module with the best correlation through MCODE, and calculate the ten genes with the best correlation through 2 algorithms (maximal clique centrality and maximum neighborhood component). After visualization, we derive the list of core genes.
2.6. Functional enrichment analysis
Gene ontology (GO) and Kyoto encyclopedia of gene and genome (KEGG) analysis are computational methods for evaluating the function and biological pathways of genetics. In this study, the list of differential genes screened by Wayne map was input into KEGG rest API (https://www.kegg.jp/kegg/rest/keggapi.html) obtained the latest KEGG Pathway gene annotation, which was used as the background, the genes were mapped to the background set, and the R software package cluster Profiler (version 3.14.3) was used for enrichment analysis to obtain the results of gene set enrichment. The GO annotation of genes in R software package org.Hs.eg.db (version 3.1.0) was also used as a background to map genes into the background set. The minimum gene set was set to 5, and the maximum gene set was set to 5000 value of < 0.05 and a FDR of < 0.25. It was considered to be a statistically significant measure.
In addition, the Metascape database can provide comprehensive gene list annotation and analysis resources, as well as visual export. We used Metascape (http://metascape.org/gp/index.html) database to analyze the functional enrichment of the above differential gene list and derive it.
2.7. Gene set enrichment analysis (GSEA)
For gene set enrichment analysis (GSEA), we obtained the GSEA software (version 3.0) from GSEA (DOI:10.1073/pnas.0506580102, http://software.broadinstitute.org/gsea/index.jsp), divided the samples into 2 groups according to liver cancer and normal tissues, and downloaded the c2.cp.kegg.v7.4.symbols.gmt subset from Molecular Signatures Database (DOI:10.1093/bioinformatics/btr260). In order to evaluate the related pathways and molecular mechanisms, based on gene expression profile and phenotypic grouping, the minimum gene set is 5, the maximum gene set is 5000, and a thousand resampling times, P value of <.05 and a FDR of < 0.25 is considered to be statistically significant. The whole genome was analyzed by GO and KEGG. Developed by GSEA.
2.8. Gene expression heat map
We use R-packet heatmap to map the expression of core genes found by 2 algorithms in PPI network in GSE121248 and GSE101728, and to visualize the difference of core gene expression between liver cancer and normal tissue samples.
2.9. Survival analysis
We found the clinical survival data of liver cancer from TCGA, and calculated the best cutoff value of Risk Score of ten core genes using R software package maxstat (version: 0.7–25). The minimum grouping sample number was more than 25%, the maximum sample number was <75%, and the best cutoff value was calculated. Based on this, the patients were divided into high and low groups, and the prognosis difference between the 2 groups was analyzed by using the survfit function of R software package survival. Log rank test method was used to evaluate the significant difference in prognosis among different groups of samples. We also used R-packet forest to make a forest map of 10 core genes to observe whether each independent core gene had a significant effect on the prognosis of liver cancer.
2.10. Comparative toxicogenomics database (CTD) analysis
CTD database (comparative toxicogenomics database) integrates a large number of chemical substances, genes, functional phenotypes and disease interaction data, which provides great convenience for the study of disease-related environmental exposure factors and drug potential mechanism. We input the core gene into the CTD website, find the disease most related to the core gene, and use Excel to draw the radar map of the differential expression of each gene.
2.11. The miRNA
TargetScan (www.targetscan.org) is an online database for predicting and analyzing miRNA and target genes. In our study, TargetScan was used to screen the miRNA that regulates central DEG.
3. Results
3.1. Differential gene analysis
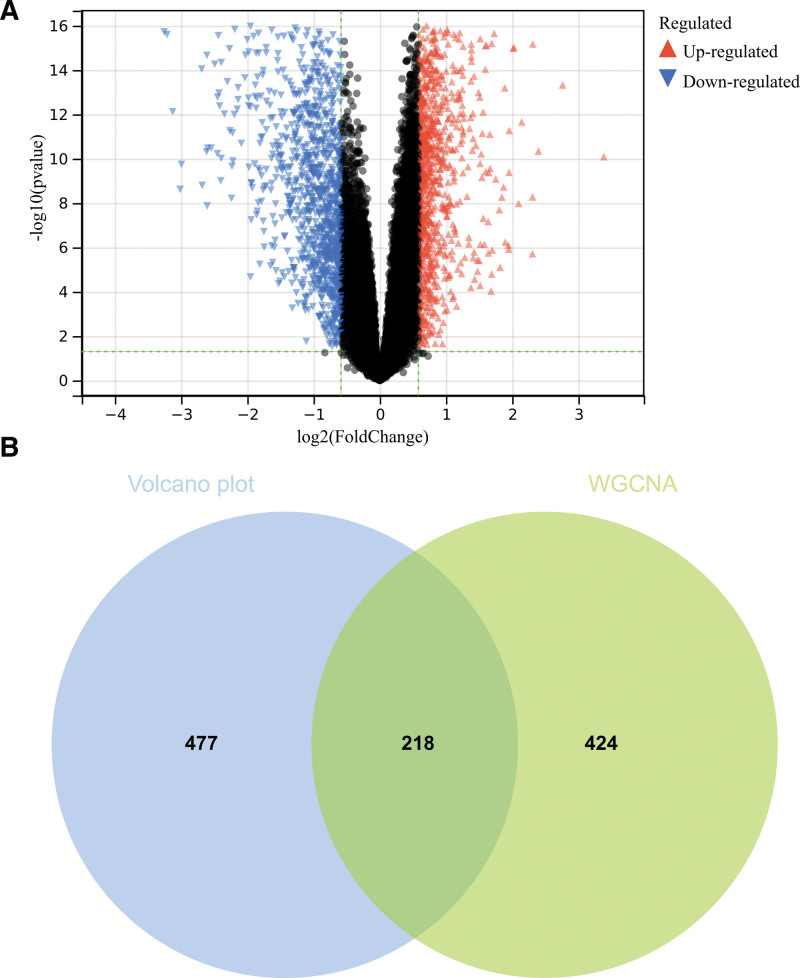
In this study, we identified differentially expressed genes according to the set cutoff value (P < .05) of the debatch-based merging matrix of GSE121248 and GSE101728. By using R software, we finally identified a total of 695 DEGs and obtained the volcano map (Fig. 1).
Figure 1.
Screening of differential epigenetic genes (DEGs). (A) 695 DEGs were identified (B) Wayne diagram and take the intersection through the differential genes screened by weighted gene co-expression network analysis (WGCNA) and DEGs.
3.2. Functional enrichment analysis
3.2.1. Functional enrichment analysis of DEGs.
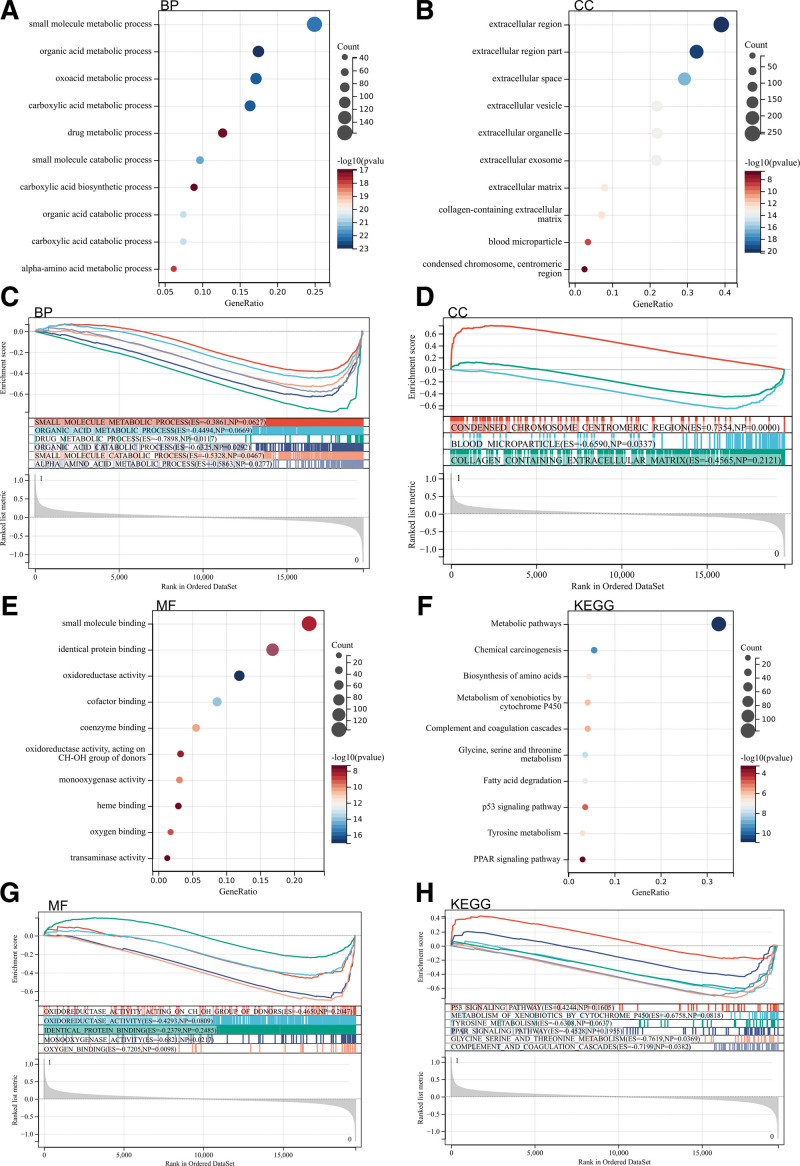
Then we analyzed these differentially expressed genes by GO and KEGG. Significantly enriched GO and KEGG pathways were screened, and the results were screened according to the significance threshold (P < .05). According to GO analysis, they were mainly enriched in organic acid metabolism process, metabolic pathway, p53 signal pathway and PPAR signal pathway (Fig. 2A, C, E, and G).
Figure 2.
Functional enrichment analysis. (A, C, E, G) Functional enrichment analysis of differential epigenetic genes (DEGs). (B, D, F, H) Gene set enrichment analysis (GSEA) analysis.
3.3. GSEA
In addition, we carried out GSEA enrichment analysis of the whole genome in order to find the possible enrichment items in non-differentially expressed genes. The enrichment items are similar to the GOKEGG enrichment items of differentially expressed genes, mainly in the process of organic acid metabolism, p53 signal pathway and PPAR signal pathway (Fig. 2B, D, F, and H)
3.4. Metascape enrichment analysis
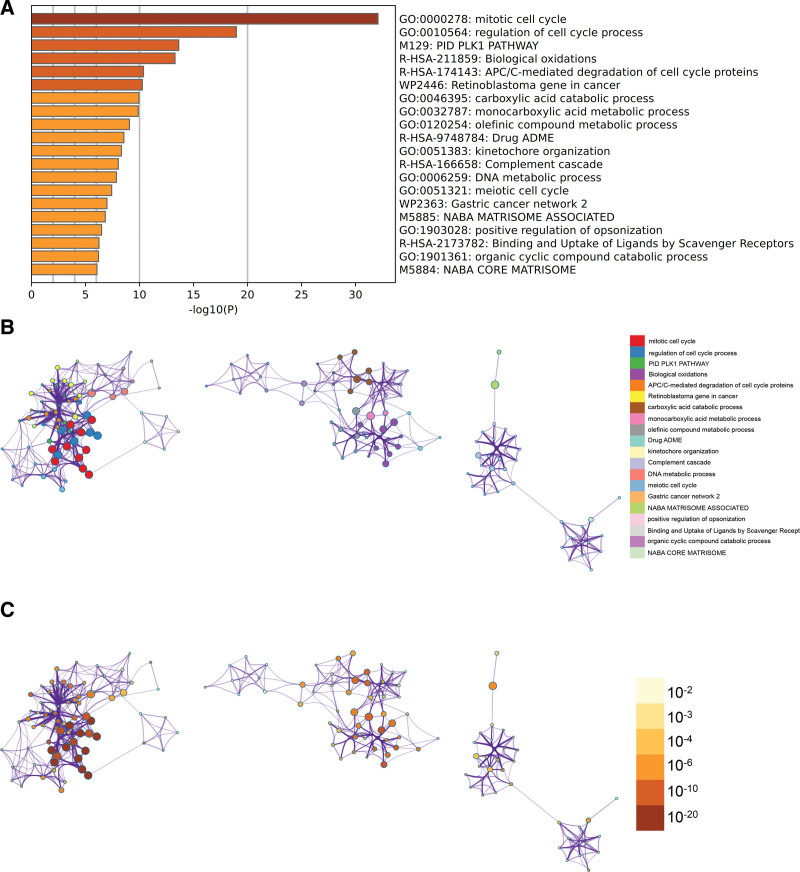
Comprehensive gene list annotation and analysis resources for differentially expressed genes were performed using Metascape and visualized for export. GO has PIDPLK1 pathway, mitotic cell cycle, tumor retinoblastoma gene (Fig. 3A), and an enrichment network stained with enrichment term and P value (Figs. 3B, C and 4).
Figure 3.
Metascape enrichment analysis. (A) Gene ontology (GO) has PIDPLK1 pathway, mitotic cell cycle, tumor retinoblastoma gene (B) enrichment networks colored by enrichment terms (C) enrichment networks colored by P values.
Figure 4.
Metascape enrichment analysis.
3.5. WGCNA
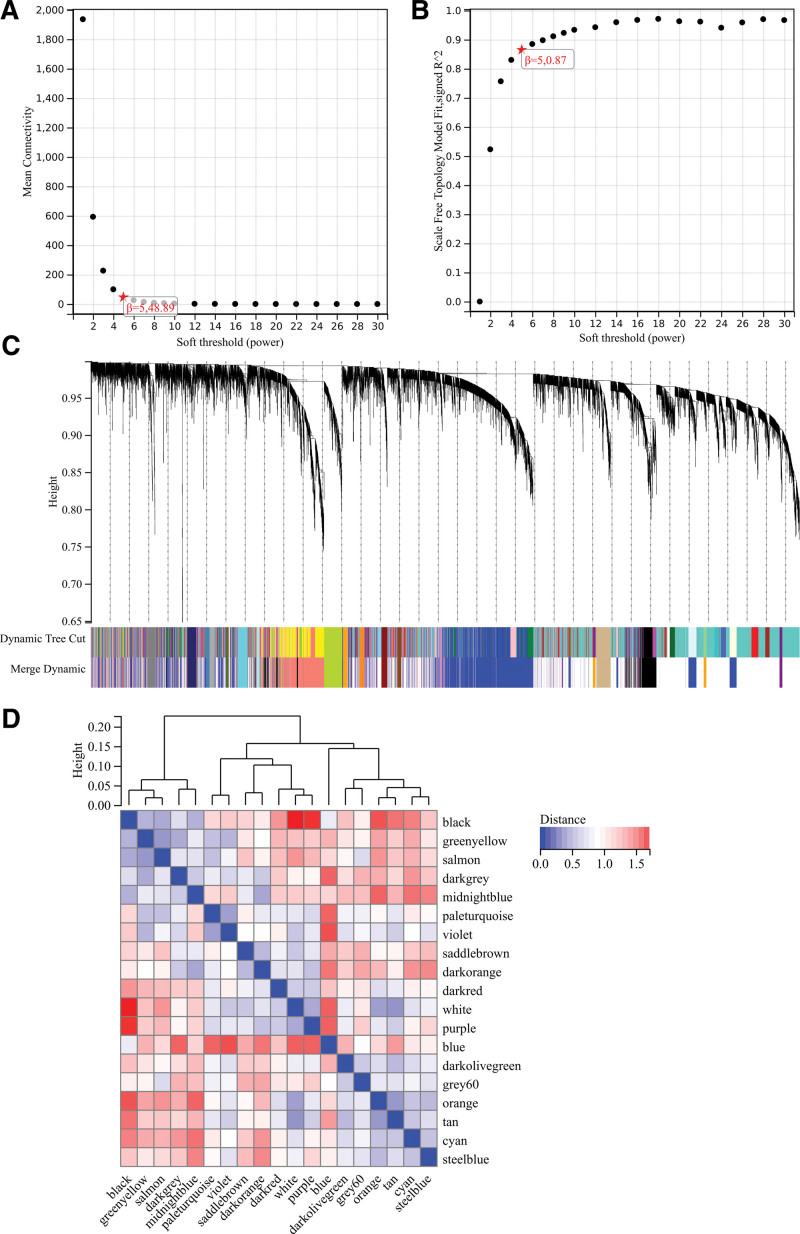
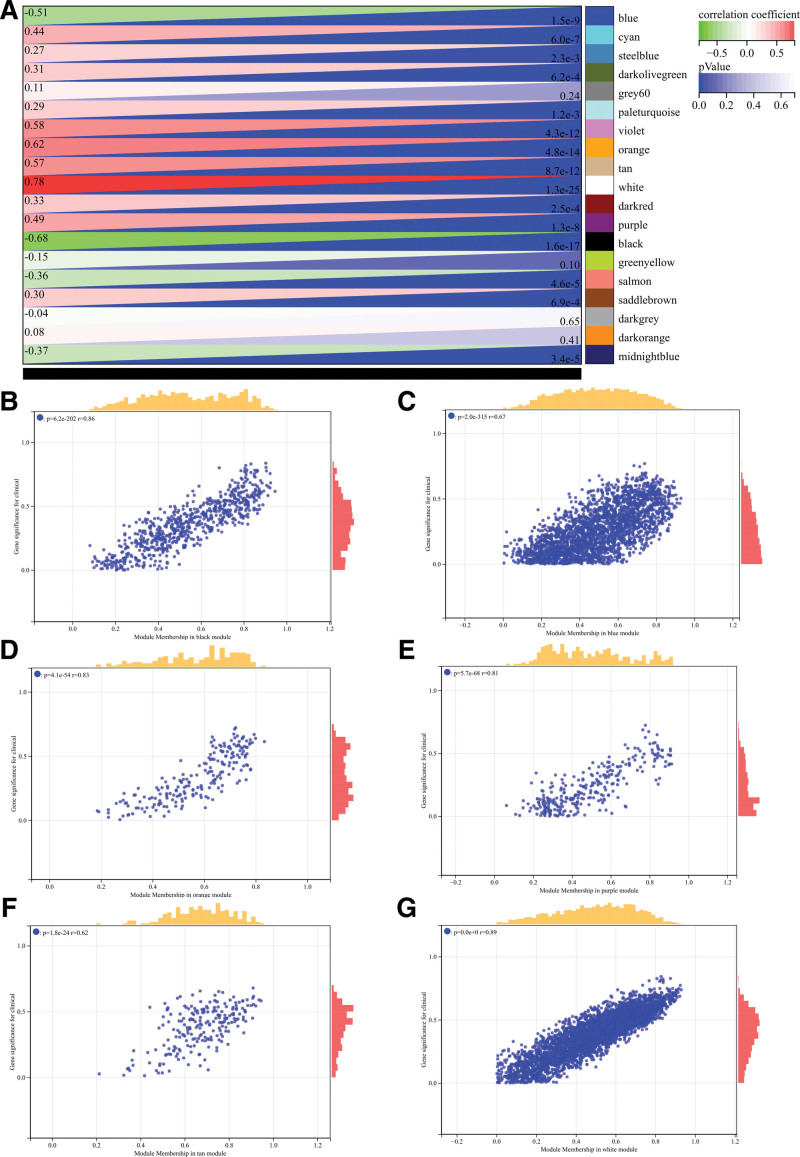
The selection of soft threshold power is an important step in WGCNA analysis. The network topology is analyzed to determine the soft threshold power. The soft threshold power in the WGCNA analysis is set to 9, which is the lowest power of the scale-free topology fitting index of 0.9 (Fig. 5A and B). The hierarchical clustering tree of all genes was constructed, and 22 important modules were generated (Fig. 5C). Then analyze the interaction between these modules (Fig. 5D). The module-phenotypic correlation heat map (Fig. 6A) and the GS-MM correlation scatter map of related hub genes (Fig. 6B–G) were generated. We calculated the correlation between module feature vectors and gene expression to obtain MM. According to the cutoff criteria (| MM | > 0.8), 11 genes with high connectivity were identified as hub genes in clinical significant modules. We also draw the Wayne diagram and take the intersection through the differential genes screened by WGCNA and DEGs (Fig. 1B).
Figure 5.
Weighted gene co-expression network analysis (WGCNA) analysis. (A) β = 5,48.89 (B) β = 5,0.87 (C) A hierarchical clustering tree of all genes is constructed and important modules are generated (D) The interaction between these modules.
Figure 6.
Weighted gene co-expression network analysis (WGCNA) analysis. (A) The module-phenotypic correlation heat map (B–G) GS-MM correlation scatter map of related hub genes.
3.6. Construction and analysis of protein-protein interaction (PPI) Network
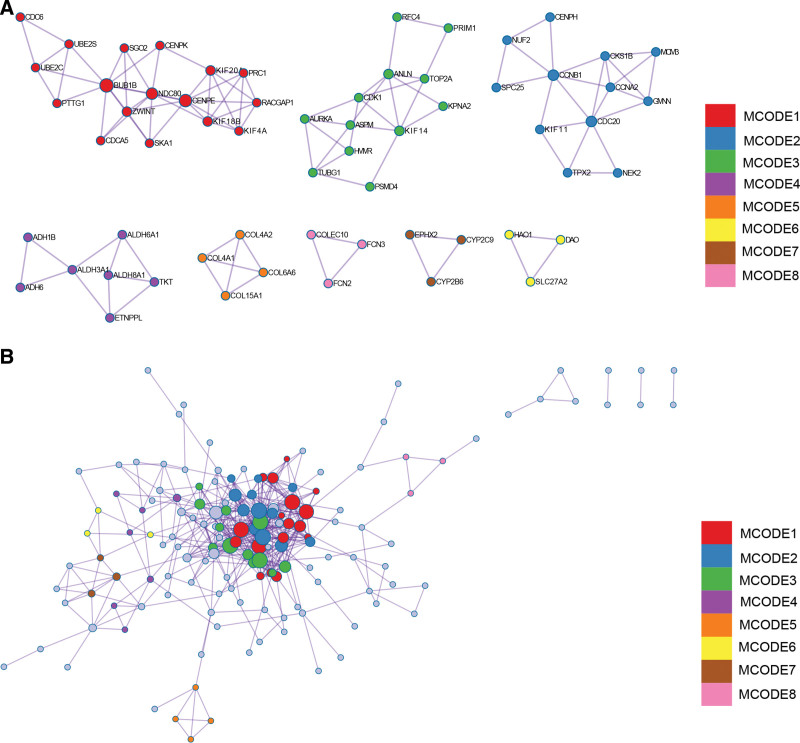
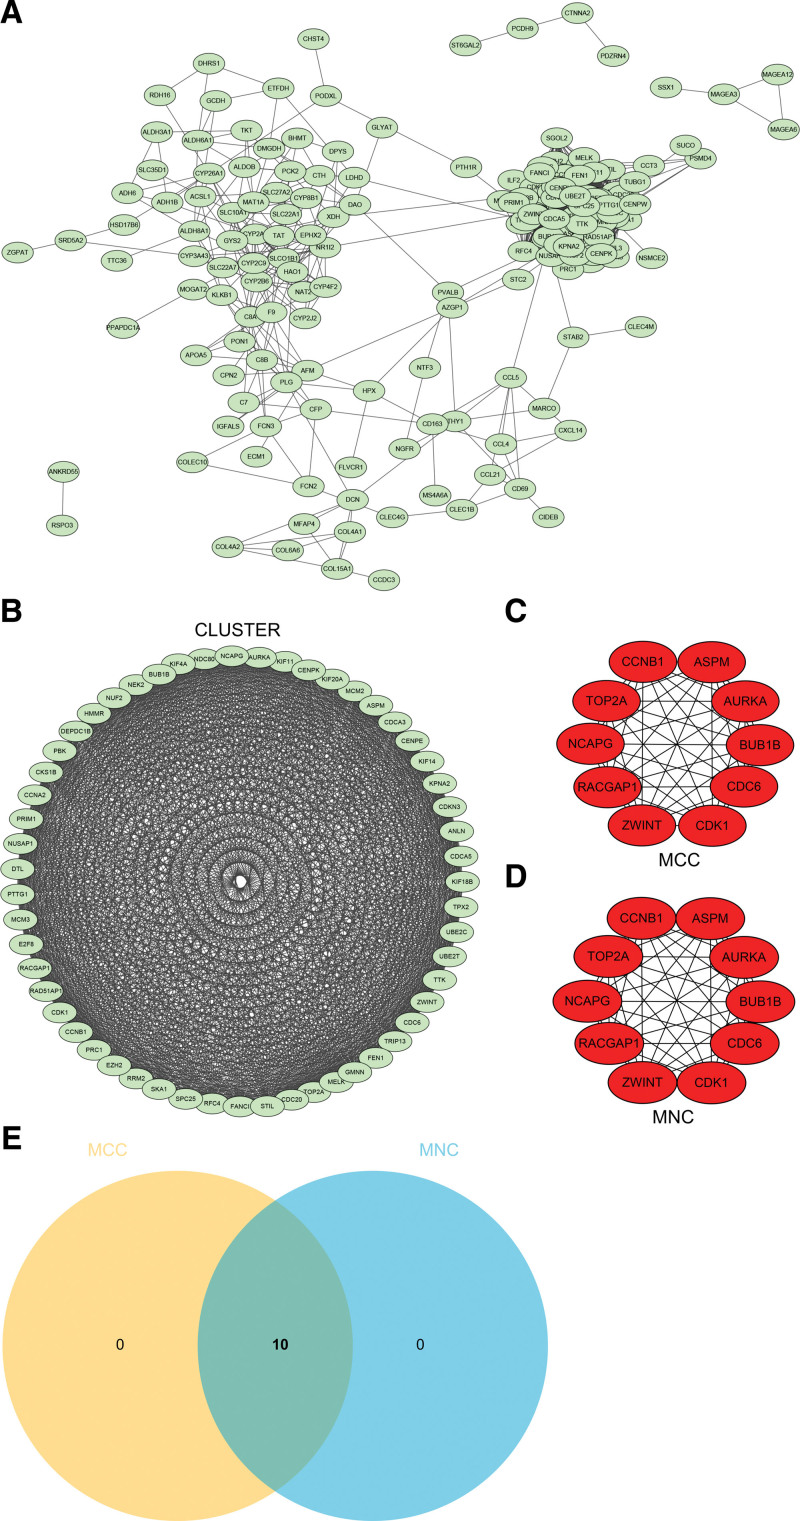
DEGs PPI network was constructed by STRING online database and analyzed by Cytoscape software (Fig. 7A). The core gene cluster (Fig. 7B) was obtained by using 2 different algorithms to identify central genes (Fig. 7C and D), and the Wayne graph was used to obtain union (Fig. 7E). Ten core genes (TOP2A, CDK1, ASPM, RACGAP1, ZWINT, CDC6, AURKA, NCAPG, BUB1B, CCNB1) were obtained.
Figure 7.
Construction and analysis of protein-protein interaction (PPI) Network. (A) PPI network (B) The core gene cluster. (C) Maximal clique centrality (MCC) was used to identify central genes (D) Maximum neighborhood component (MNC) was used to identify central genes (E) Wayne graph was used to obtain union.
3.7. Prognostic score relationship and gene expression thermograph
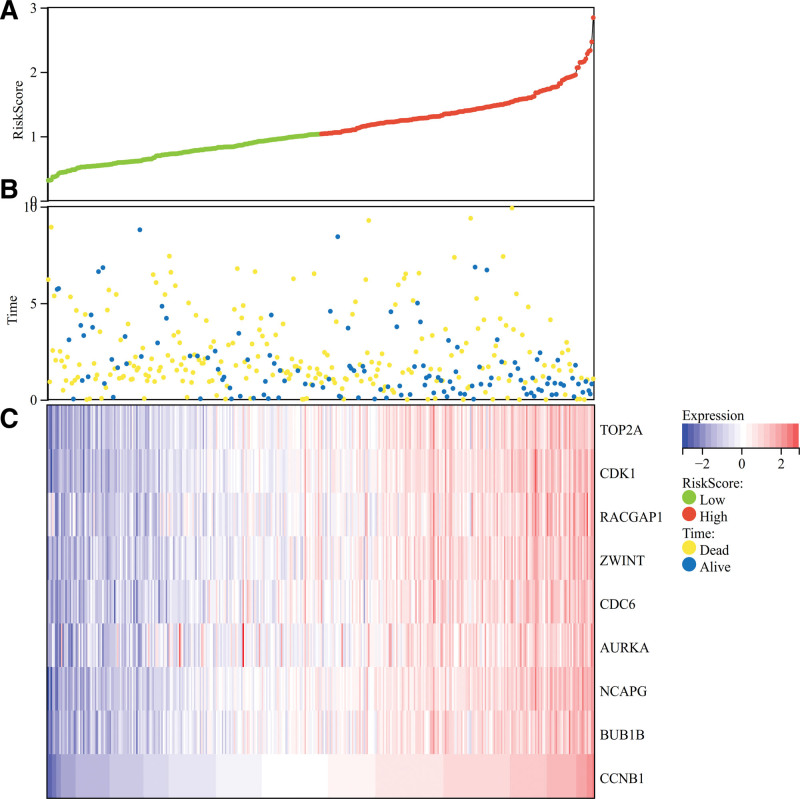
Using the clinical data of liver cancer obtained from TCGA, the prognostic score relationship map of the above 10 core genes and the differential expression heat map of core genes were calculated and drawn by R software. We found that the survival time and survival rate in the normal tissue were significantly higher than those in the HCC (Fig. 8A and B). We obtained 10 core genes (TOP2A, CDK1, ASPM, RACGAP1, ZWINT, CDC6, AURKA, NCAPG, BUB1B, CCNB1) and found that these core genes were highly expressed in tumor tissues and low in normal tissues (Fig. 8C).
Figure 8.
Prognostic score relationship and gene expression thermograph. The heat map of the expression of core genes in the samples. (A and B) The survival time and survival rate in the normal tissue were significantly higher than those in the hepatocellular carcinoma (C) 10 core genes (TOP2A, CDK1, ASPM, RACGAP1, ZWINT, CDC6, AURKA, NCAPG, BUB1B, CCNB1) and found that these core genes were highly expressed in tumor tissues and low in normal tissues.
3.8. Survival analysis
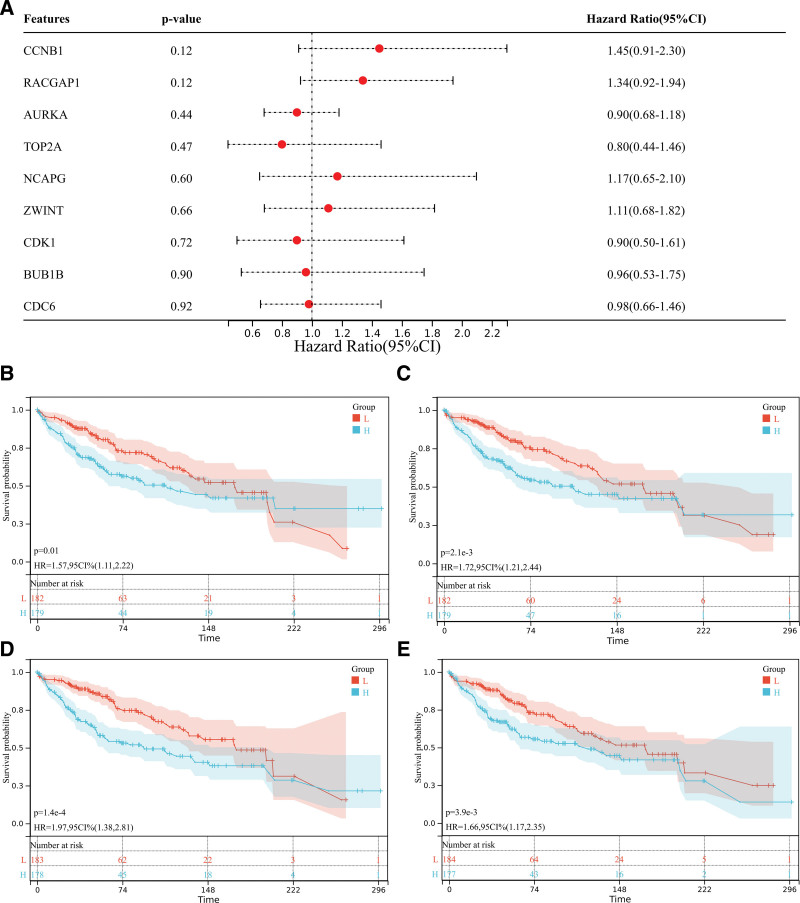
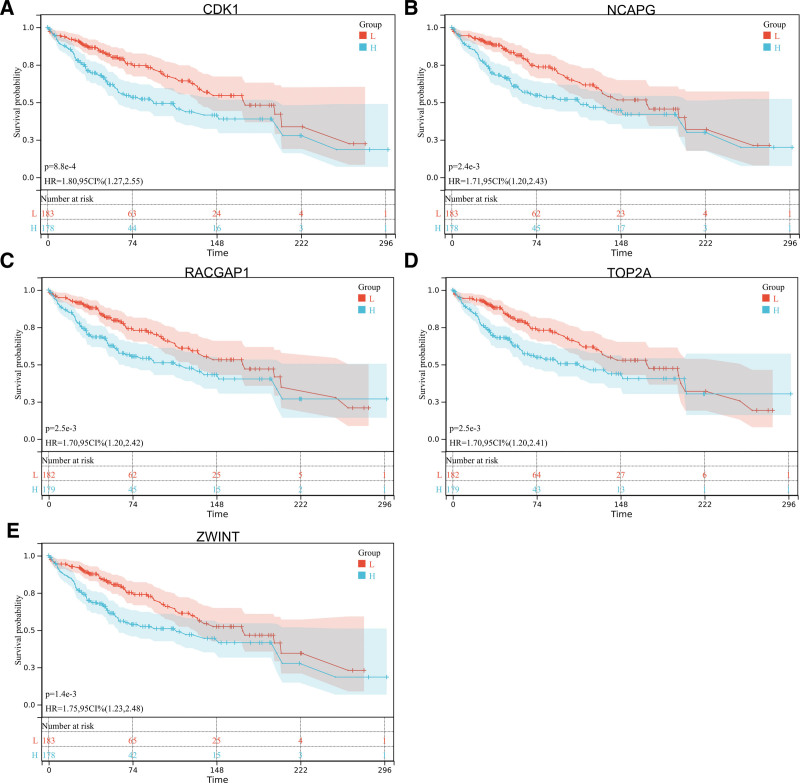
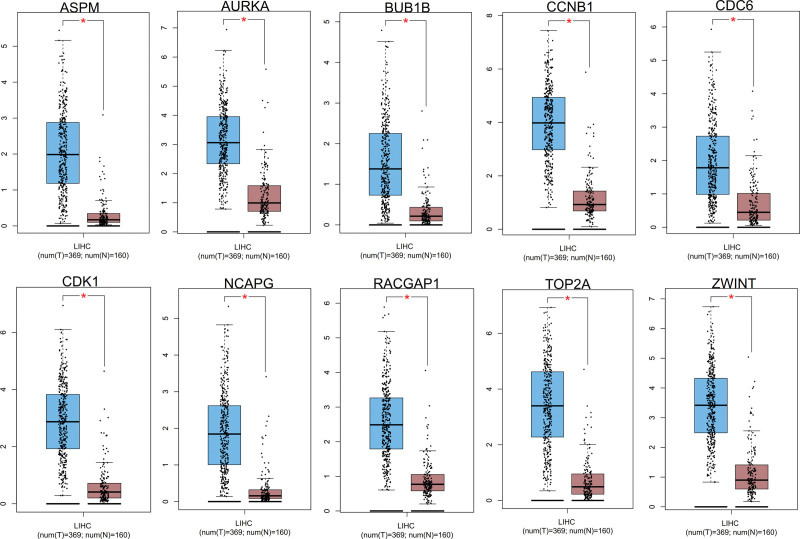
We obtained the forest map of core genes (TOP2A, CDK1, ASPM, RACGAP1, ZWINT, CDC6, AURKA, NCAPG, BUB1B, CCNB1) associated with liver cancer (Fig. 9A), and the survival curve of 9 core genes (Figs. 9B–E and 10). The box map of the core gene in HCC was also obtained (Fig. 11). The results showed that the core genes were related to the prognosis and survival of HCC.
Figure 9.
Survival analysis. (A) The forest map of core genes (TOP2A, CDK1, ASPM, RACGAP1, ZWINT, CDC6, AURKA, NCAPG, BUB1B, CCNB1) associated with liver cancer. (B–E) The survival curve of core genes.
Figure 10.
The survival curve of core genes.
Figure 11.
The box map of the core gene in hepatocellular carcinoma. *P < .05.
3.9. CTD analysis
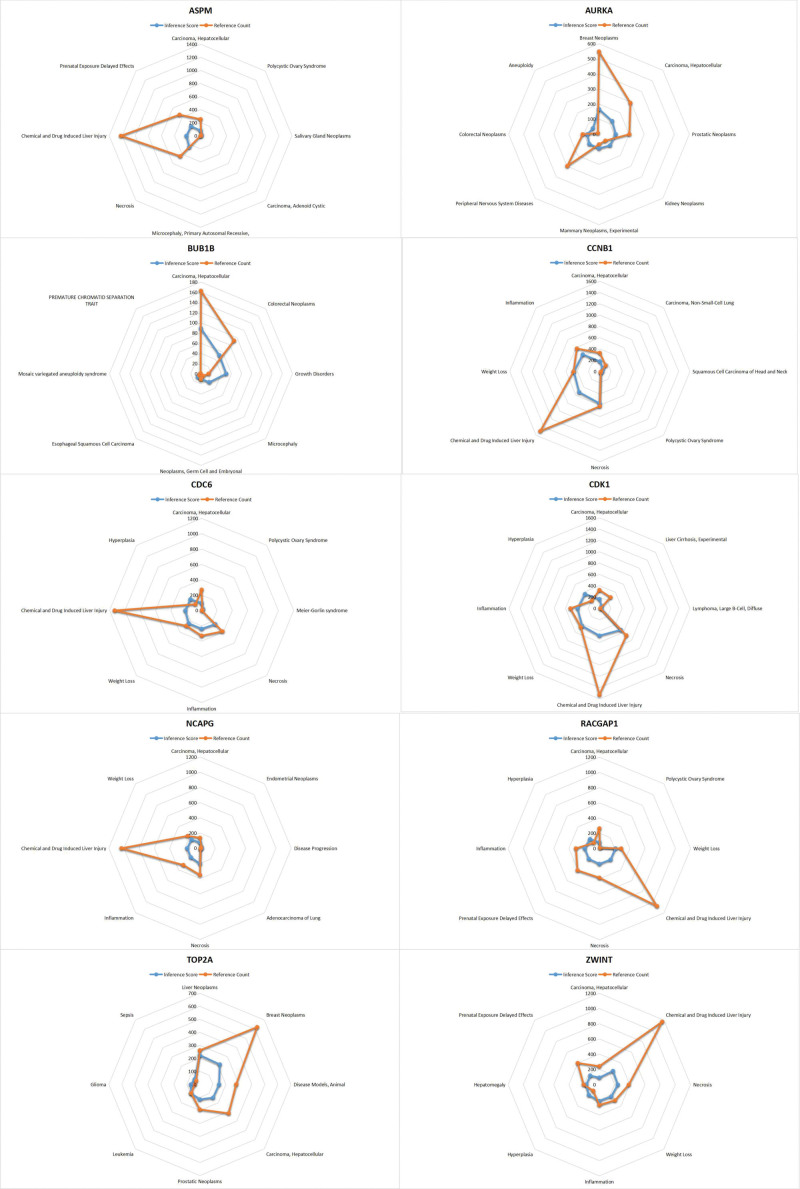
In this study, we entered the hub gene list into the CTD website to find diseases related to core genes, improving the understanding of the association between genes and diseases. Ten genes (TOP2A, CDK1, ASPM, RACGAP1, ZWINT, CDC6, AURKA, NCAPG, BUB1B, CCNB1) were found to be associated with necrosis, inflammation, HCC, liver cirrhosis and adenoid cystic carcinoma (Fig. 12).
Figure 12.
Comparative toxicogenomics database (CTD) analysis. Ten genes (TOP2A, CDK1, ASPM, RACGAP1, ZWINT, CDC6, AURKA, NCAPG, BUB1B, CCNB1) were found to be associated with necrosis, inflammation, hepatocellular carcinoma, liver cirrhosis and adenoid cystic carcinoma.
3.10. The miRNA prediction and functional annotation related to hub gene
In this study, we input the hub gene list into targetsacan to find the relevant miRNA to improve the understanding of gene expression regulation (Table 1). We found that the associated miRNA of TOP2A gene is related to hsa-miR-144-3ptCDKl gene, miRNA is related to hsa-miR-203a-3p.2;RACGAP1 gene, related to miRNA is hsa-miR-19b-3p, related to hsa-miR-19a-3p;CDC6 gene is related to hsamiR-1297, hsa-miR-26b-5p, and related to hsa-miR-26a-5p;AURKA gene miRNA is related to hsamiR-490-3ptingNCAPG gene related to miRNA is hsa-miR-9-5p. The related miRNA of CCNB1 gene is hsa-miR-183-5p.1.
Table 1.
A summary of miRNAs that regulate hub genes.
| Gene | MIRNA | |||
|---|---|---|---|---|
| 1 | TOP2A | hsa-miR-144-3p | ||
| 2 | CDK1 | hsa-miR-203a-3p.2 | ||
| 3 | RACGAP1 | hsa-miR-19b-3p | hsa-miR-19a-3p | |
| 4 | CDC6 | hsa-miR-1297 | hsa-miR-26b-5p | hsa-miR-26a-5p |
| 5 | AURKA | hsa-miR-490-3p | ||
| 6 | NCAPG | hsa-miR-9-5p | ||
| 7 | CCNB1 | hsa-miR-183-5p.1 | ||
| 8 | ASPM | None | ||
| 9 | ZWINT | None | ||
| 10 | BUB1B | None | ||
4. Discussion
HCC is the sixth most common type of cancer in the world, with the third highest mortality.[15] HCC has become an important public health problem worldwide because of its high mortality. Although surgery is considered to be the most effective treatment for patients with liver cancer, the high incidence of tumor recurrence after operation will have a negative impact on the outcome and survival rate after treatment.[16] Tumor recurrence within 5 years after surgery has been observed in 70% of HCC patients worldwide.[17] In addition, tumor heterogeneity helps to increase tumor resistance to conventional chemotherapy and targeted therapy.[18] The identification of new prognostic biomarkers and treatment targets may improve the clinical outcome of patients with HCC. Therefore, in-depth exploration of the molecular mechanism of liver cancer is very important for the study of targeted drugs. The main result of this study is that TOP2A and CDC6 are highly expressed in HCC. The higher TOP2A and CDC6, the worse the prognosis. TOP2A and CDC6 are more correlated with prognosis. In the transcriptome data, the difference between TOP2A and CDC6 is more obvious. In addition, in the relevant literature, TOP2A and CDC6 may be more correlated with cancer progression.[19,20]
DNA topoisomerase is an enzyme that can control and change the topological state of DNA in the process of transcription. According to the short single strand or double strand breaks in DNA, they can be divided into 2 types: type I and type II.[21] DNA topoisomerase 2-α (TOP2A) gene is located on human chromosome 17 (17q21-22) and encodes DNA topoisomerase II α. DNA topoisomerase II α can control and change the topological structure, chromosome segregation and cell cycle process of DNA.[22] TOP2A plays an important role in important life processes such as DNA replication, transcription and filament. In recent years, more and more studies have shown that TOP2A is significantly expressed in tumor tissues, which is negatively correlated with the prognosis of tumor patients. Many studies have shown that TOP2A can be used as a prognostic biomarker and potential therapeutic target for bladder cancer, such as bladder urothelial cancer, lung cancer, prostate cancer, colon cancer and breast cancer.[23,24] It is reported that DNA topological isomers, especially IIA topological isomers, have been proved to be therapeutic targets for anticancer and antibacterial drugs.[25] In addition, Liu et al reported the interaction between MDM4 and TOP2A after binding, which up-regulated each other at the post-translation level, resulting in the stability of TOP2A protein, inhibition of p53 pathway and increase of tumor cell proliferation.[26] It was found that TOP2A mRNA and TOP2A proteins showed significant levels in HCC, indicating that TOP2A was overexpressed in HCC, and TOP2A may be a potential biomarker of HCC.[27] Meng et al found that TOP2A was overexpressed in patients with HCC and its mRNA expression was significantly correlated with the individual cancer stage of HCC patients. It is worth noting that TOP2A may play a role in promoting hepatocyte development by participating in progesterone-mediated oocyte maturation pathway and oocyte subtractive division pathway.[28] In the study of Dong et al we observed a significant increase in the expression of TOP2A in HCC cells and tissues which may lead to a high incidence of distant metastasis and predict a lower survival rate of patients. In addition, TOP2A has been shown to potentially enhance the migration and invasion of HCC cells by triggering EMT mediated by p-ERK1/2/p-SMAD2 (S425/snail signal pathway)/ snail signal pathway.[29] Wang through bioinformatics analysis and clinical specimen verification, found that TOP2A was highly expressed in HCC and was related to poor prognosis. Knockout and overexpression of TOP2A gene can inhibit or promote the proliferation, metastasis and invasion of HCC cells in vitro and in vivo, respectively. TOP2A activates the process of cell cycle from G2 to M phase by inhibiting CHK1 phosphorylation and promoting epithelial-mesenchymal transformation. TOP2A plays a role by promoting the proliferation, migration, invasion and epithelial-mesenchymal transformation of HCC.[30] The above literature review is consistent with our results, our study found that the high expression of TOP2A in HCC, the higher the TOP2A, the worse the prognosis. Therefore, it is speculated that TOP2A may play an important role in the occurrence and development of liver cancer, and TOP2A can be used as a potential target for HCC therapy.
CDC6 (cell division cycle 6) is highly similar to Saccharomyces cerevisiae Cdc6, a protein essential for the initiation of DNA replication. CDC6 is the regulator of the early steps of DNA replication and participates in checkpoint control to ensure that DNA replication is completed before mitosis begins. Studies have found that many diseases involve CDC6 disorders, such as Meier–Gorlin syndrome 5, Meier–Gorlin syndrome 1 and various tumors.[19] At present, many scholars have confirmed that CDC6 is involved in the prognosis and development of various cancers. For example, Zhao et al found that CDC6 is up-regulated in pleomorphic glioblastoma and is closely related to poor prognostic characteristics.[31] Jiang et al have demonstrated that down-regulation of CDC6 inhibits the tumorigenesis of osteosarcoma in vivo and in vitro. The above studies have shown that the expression of CDC6 is up-regulated in tumors, while knocking down the expression of CDC6 can significantly inhibit the carcinogenic development of cancer. In the study of Sun et al, the expression of CDC6 protein in HCC was searched by online database. The results showed that the expression of CDC6 in HCC was higher than that in normal liver tissue. The higher expression level of CDC6 is closely related to the lower overall survival rate. CDC6 can be used as a biomarker for many patients with HCC.[32] Shi et al found that overexpressed CDC6 can promote the viability, migration and invasion of HCC cells. In HCC cells, overexpression of CDC6 inhibits the expression of E-Cadherin while promoting the expression of MMP2, MMP9, N-Cadherin and Vimentin.[33] Preliminary bioinformatics analysis of hepatitis D virus-related HCC shows that CDC6, which is related to cell cycle, DNA replication and mitotic cell cycle, is the core gene of HCC. Similarly, in another bioinformatics study, CDC6 is the core gene of HCC and is associated with tumor regulatory pathways.[34,35] The above literature review is consistent with our results, our study found that the high expression of CDC6 in HCC, the higher the CDC6, the worse the prognosis. Therefore, it is speculated that CDC6 may play an important role in the occurrence and development of liver cancer, and CDC6 can be used as a potential target for HCC therapy.
5. Limitations and possible biases
Although this paper has carried out rigorous bioinformatics analysis, there are still some shortcomings. In this study, no animal experiments of gene overexpression or knockout were carried out to further verify its function. Moreover, possible selection biases, small sample size, and possible measurement errors may all have some impact on the results.
6. Conclusion
TOP2A and CDC6 are highly expressed in HCC, and may play a significant role in the development of HCC through inflammation and immune cell regulation. TOP2A and CDC6 may be used as molecular targets for early diagnosis and precise treatment of liver cancer, and provide a basis for the study of the mechanism of liver cancer.
Author contributions
Conceptualization: Wei Jia.
Data curation: Zhilei Zhang.
Methodology: Xiang Liu, Zhilei Zhang.
Software: Xiang Liu, Zhilei Zhang.
Validation: Wei Jia.
Visualization: Wei Jia.
Writing – original draft: Zhilei Zhang.
Writing – review & editing: Wei Jia.
Abbreviations:
- CTD
- comparative toxicogenomics database
- DEGs
- differential epigenetic genes
- FDR
- error detection rate
- GO
- gene ontology
- GSEA
- gene set enrichment analysis
- HCC
- hepatocellular carcinoma
- KEGG
- Kyoto encyclopedia of gene and genome
- PPI
- protein-protein interaction
- STRING
- search tool for the retrieval of interacting genes
- TOM
- topological overlap matrix
- WGCNA
- weighted gene co-expression network analysis
XL and ZZ contributed equally to this work.
This study was approved by the Fourth Affiliated Hospital of Hebei Medical University.
The authors have no funding and conflicts of interest to disclose.
The datasets generated during and/or analyzed during the current study are available from the corresponding author on reasonable request.
How to cite this article: Jia W, Liu X, Zhang Z. Role of TOP2A and CDC6 in liver cancer. Medicine 2023;102:42(e35604).
Contributor Information
Xiang Liu, Email: xiangliu634@163.com.
Zhilei Zhang, Email: zhilei3652@163.com.
References
- [1].Forner A, Reig M, Bruix J. Hepatocellular carcinoma. Lancet. 2018;391:1301–14. [DOI] [PubMed] [Google Scholar]
- [2].Sim HW, Knox J. Hepatocellular carcinoma in the era of immunotherapy. Curr Probl Cancer. 2018;42:40–8. [DOI] [PubMed] [Google Scholar]
- [3].Piñero F, Dirchwolf M, Pessôa MG. Biomarkers in hepatocellular carcinoma: diagnosis, prognosis and treatment response assessment. Cells. 2020;9:1370. [DOI] [PMC free article] [PubMed] [Google Scholar]
- [4].Clark T, Maximin S, Meier J, et al. Hepatocellular carcinoma. Nat Rev Dis Primers. 2021;7:7.33479233 [Google Scholar]
- [5].Clark T, Maximin S, Meier J, et al. Hepatocellular carcinoma: review of epidemiology, screening, imaging diagnosis, response assessment, and treatment. Curr Probl Diagn Radiol. 2015;44:479–86. [DOI] [PubMed] [Google Scholar]
- [6].Jiří T, Igor K, Mba. Hepatocellular carcinoma future treatment options. Klin Onkol. 2020;33(Supplementum 3):26–9. [DOI] [PubMed] [Google Scholar]
- [7].Gilles H, Garbutt T, Landrum J. Hepatocellular carcinoma. Crit Care Nurs Clin North Am. 2022;34:289–301. [DOI] [PubMed] [Google Scholar]
- [8].Parikh ND, Pillai A. Recent advances in hepatocellular carcinoma treatment. Clin Gastroenterol Hepatol. 2021;19:2020–4. [DOI] [PubMed] [Google Scholar]
- [9].Heller M, Parikh ND, Fidelman N, et al. Frontiers of therapy for hepatocellular carcinoma. Abdom Radiol (NY). 2021;46:3648–59. [DOI] [PubMed] [Google Scholar]
- [10].Vyas M, Zhang X. Hepatocellular carcinoma: role of pathology in the era of precision medicine. Clin Liver Dis. 2020;24:591–610. [DOI] [PubMed] [Google Scholar]
- [11].Vranic S, Gatalica Z. The role of pathology in the era of personalized (precision) medicine: a brief review. Acta Med Acad. 2021;50:47–57. [DOI] [PubMed] [Google Scholar]
- [12].Kudo M, Kawamura Y, Hasegawa K, et al. Management of hepatocellular carcinoma in Japan: JSH consensus statements and recommendations 2021 update. Liver Cancer. 2021;10:181–223. [DOI] [PMC free article] [PubMed] [Google Scholar]
- [13].Goh J, Goh C, Lim QW, et al. Transcriptomics indicate nuclear division and cell adhesion not recapitulated in MCF7 and MCF10A compared to luminal A breast tumours. Sci Rep. 2022;12:20902. [DOI] [PMC free article] [PubMed] [Google Scholar]
- [14].Hartsough EJ, Weiss MB, Heilman SA, et al. CADM1 is a TWIST1-regulated suppressor of invasion and survival. Cell Death Dis. 2019;10:281. [DOI] [PMC free article] [PubMed] [Google Scholar]
- [15].Sung H, Ferlay J, Siegel RL, et al. Global Cancer Statistics 2020: GLOBOCAN estimates of incidence and mortality worldwide for 36 cancers in 185 countries. CA Cancer J Clin. 2021;71:209–49. [DOI] [PubMed] [Google Scholar]
- [16].Wang S, Sun H, Xie Z, et al. Improved survival of patients with hepatocellular carcinoma and disparities by age, race, and socioeconomic status by decade, 1983-2012. Oncotarget. 2016;7:59820–33. [DOI] [PMC free article] [PubMed] [Google Scholar]
- [17].Zhou J, Sun H, Wang Z, et al. Guidelines for the diagnosis and treatment of hepatocellular carcinoma (2019 edition). Liver Cancer. 2020;9:682–720. [DOI] [PMC free article] [PubMed] [Google Scholar]
- [18].Heinrich S, Craig AJ, Ma L, et al. Understanding tumour cell heterogeneity and its implication for immunotherapy in liver cancer using single-cell analysis. J Hepatol. 2021;74:700–15. [DOI] [PubMed] [Google Scholar]
- [19].Lim N, Townsend PA. Cdc6 as a novel target in cancer: oncogenic potential, senescence and subcellular localisation. Int J Cancer. 2020;147:1528–34. [DOI] [PMC free article] [PubMed] [Google Scholar]
- [20].Uusküla-Reimand L, Wilson MD. Untangling the roles of TOP2A and TOP2B in transcription and cancer. Sci Adv. 2022;8:eadd4920. [DOI] [PMC free article] [PubMed] [Google Scholar]
- [21].Bush NG, Evans-Roberts K, Maxwell A. DNA topoisomerases. EcoSal Plus. 2015;6. [DOI] [PMC free article] [PubMed] [Google Scholar]
- [22].Watt PM, Hickson ID. Structure and function of type II DNA topoisomerases. Biochem J. 1994;303 (Pt 3)(Pt 3):681–95. [DOI] [PMC free article] [PubMed] [Google Scholar]
- [23].Zeng S, Liu A, Dai L, et al. Prognostic value of TOP2A in bladder urothelial carcinoma and potential molecular mechanisms. BMC Cancer. 2019;19:604. [DOI] [PMC free article] [PubMed] [Google Scholar]
- [24].Zhang R, Xu J, Zhao J, et al. Proliferation and invasion of colon cancer cells are suppressed by knockdown of TOP2A. J Cell Biochem. 2018;119:7256–63. [DOI] [PubMed] [Google Scholar]
- [25].Delgado JL, Hsieh CM, Chan NL, et al. Topoisomerases as anticancer targets. Biochem J. 2018;475:373–98. [DOI] [PMC free article] [PubMed] [Google Scholar]
- [26].Liu T, Zhang H, Yi S, et al. Mutual regulation of MDM4 and TOP2A in cancer cell proliferation. Mol Oncol. 2019;13:1047–58. [DOI] [PMC free article] [PubMed] [Google Scholar] [Retracted]
- [27].Wong N, Yeo W, Wong WL, et al. TOP2A overexpression in hepatocellular carcinoma correlates with early age onset, shorter patients survival and chemoresistance. Int J Cancer. 2009;124:644–52. [DOI] [PubMed] [Google Scholar]
- [28].Meng J, Wei Y, Deng Q, et al. Study on the expression of TOP2A in hepatocellular carcinoma and its relationship with patient prognosis. Cancer Cell Int. 2022;22:29. [DOI] [PMC free article] [PubMed] [Google Scholar]
- [29].Dong Y, Sun X, Zhang K, et al. Type IIA topoisomerase (TOP2A) triggers epithelial-mesenchymal transition and facilitates HCC progression by regulating Snail expression. Bioengineered. 2021;12:12967–79. [DOI] [PMC free article] [PubMed] [Google Scholar]
- [30].Wang T, Lu J, Wang R, et al. TOP2A promotes proliferation and metastasis of hepatocellular carcinoma regulated by miR-144-3p. J Cancer. 2022;13:589–601. [DOI] [PMC free article] [PubMed] [Google Scholar]
- [31].Zhao H, Zhou X, Yuan G, et al. CDC6 is up-regulated and a poor prognostic signature in glioblastoma multiforme. Clin Transl Oncol. 2021;23:565–71. [DOI] [PubMed] [Google Scholar]
- [32].Kong DG, Yao FZ. CDC6 is a possible biomarker for hepatocellular carcinoma. Int J Clin Exp Pathol. 2021;14:811–8. [PMC free article] [PubMed] [Google Scholar]
- [33].Shi Y, Yan F, Wang F, et al. MiR-128-3p suppresses tumor proliferation and metastasis via targeting CDC6 in hepatocellular carcinoma cells. Tissue Cell. 2021;72:101534. [DOI] [PubMed] [Google Scholar]
- [34].Yu Z, Ma X, Zhang W, et al. Microarray data mining and preliminary bioinformatics analysis of hepatitis D virus-associated hepatocellular carcinoma. Biomed Res Int. 2021;2021:1093702. [DOI] [PMC free article] [PubMed] [Google Scholar]
- [35].Morovat P, Morovat S, Ashrafi AM, et al. Identification of potentially functional circular RNAs hsa_circ_0070934 and hsa_circ_0004315 as prognostic factors of hepatocellular carcinoma by integrated bioinformatics analysis. Sci Rep. 2022;12:4933. [DOI] [PMC free article] [PubMed] [Google Scholar]


