Abstract
Light signaling via the phytochrome A (phyA) photoreceptor controls basic plant developmental processes including de-etiolation and hypocotyl elongation. We have identified a new Arabidopsis mutant, pat (phytochrome A signal transduction)1-1, which shows strongly reduced responses in continuous far-red light. Physiological and molecular data indicate that this mutant is disrupted at an early step of phyA signal transduction. The PAT1 gene encodes a cytoplasmic protein of 490 amino acids with sequence homologies to the plant-specific GRAS regulatory protein family. In the pat1-1 mutant, a T-DNA insertion introduces a premature stop codon, which likely results in the production of a truncated PAT1 protein of 341 amino acids. The semidominant phenotype of this mutant can be recapitulated by overexpression of an appropriately truncated PAT1 gene in the wild type. The results indicate that the truncated PAT1 protein acts in a dominant-negative fashion to inhibit phyA signaling.
Keywords: Signal transduction, phytochrome A, far-red, Arabidopsis, GRAS proteins
Photoreceptors monitor the intensity, direction, and period of light stimuli of different wavelengths. This sensory system allows higher plants to control essential life functions from germination to the seedling stage and during the adult life. Members of the phytochrome (phy) photoreceptor family perceive the red and far-red (FR) region of the light spectrum and exist in photoconvertible R (Pr) and FR (Pfr) light-absorbing forms. The latter is thought to be the main activator of the downstream light-signal cascade (Furuya 1993; Quail et al. 1995; Fankhauser and Chory 1997; Neff et al. 2000). Phytochromes are encoded by a gene family and classified according to their stability in light. Phytochrome A is negatively regulated by light at the transcriptional level (Lissemore and Quail 1988; Sato 1988; Canton and Quail 1999) and the Pfr form of the protein is light labile (Furuya 1989; Henning et al. 1999), nevertheless the protein accumulates in etiolated tissues in the Pr form. Owing to its biochemical characteristics, phyA plays a distinct role in the control of de-etiolation during dark–light transition of plant development. Phytochromes phyB, C, D and E are light-stable, but less abundant than phyA. They are involved in different aspects of R light perception.
Different approaches have been applied to understand how the FR light signal is mediated by phyA. Biochemical and pharmacological studies suggested the involvement of GTP-binding proteins, cGMP, and Ca2+/Calmodulin (CaM) in the control of well-defined transcriptional responses of the phyA transduction pathway (Neuhaus et al. 1993; Bowler et al. 1994). Another approach to identifying components in the signal transduction was to isolate phytochrome-interacting partners by using two-hybrid screens. Three candidates have been isolated so far, PIF3 (Ni et al. 1998), PKS1 (Fankhauser et al. 1999), and NDPK2 (Choi et al. 1999). All three proteins have been shown to interact not only with the carboxyl terminus of phyA but also with phyB. This property is reflected in the characteristics of the respective knockout mutants or antisense and overexpression lines. Antisense lines of PIF3, encoding a basic helix–loop–helix protein, show a decrease in their light sensitivity in red light and only minimally in FR light. Overexpression of PKS1 leads to slightly elongated hypocotyls under red light, but no effect was observed under FR light and in antisense plants. NDPK2 loss-of-function mutants under FR light show a phenotype in the cotyledon opening and hook straightening, whereas in red light, hypocotyl length and cotyledon opening are less sensitive.
The genetic approach has resulted in the isolation of mutants, especially in Arabidopsis, which exhibit different light-dependent phenotypes (for review, see Deng and Quail 1999; Fankhauser and Chory 1997; Neff et al. 2000). Mutants specific to the phyA-signaling pathway would be expected to show a strong effect under FR light but minimal effects under other light conditions. So far, only fhy1, fhy3, spa1, fin2, and far1 have been identified as being disrupted specifically in downstream components of phyA signaling (Whitelam et al. 1993; Hoecker et al. 1998; Soh et al. 1998; Hudson et al. 1999). Two of these, spa1 and far1, have been characterized at the molecular level (Hoecker et al. 1999; Hudson et al. 1999).
Recently, we have developed a novel genetic screen to identify mutants specifically affected in phyA signal transduction. This approach is based on the observation that the exposure of wild-type seedlings to continuous FR light perceived by phyA leads to partial photomorphogenic development of Arabidopsis plants with short hypocotyls, open hooks, and unfolded cotyledons. Under these conditions chlorophyll cannot accumulate as the protochlorophyllide oxidoreductase (POR) cannot be activated by FR light and therefore does not catalyze the transformation of protochlorophyllide into chlorophyll. In FR-exposed seedlings the prolamellar body, usually found in etioplasts, is dispersed and vesicles accumulate in the stroma of the plastids. Because these plastids cannot develop into chloroplasts on subsequent exposure to white light, FR-pretreated wild-type seedlings are unable to accumulate chlorophyll and die (van Tuinen et al. 1995; Barnes et al. 1996a). This FR-induced killing appears to result from severe down-regulation of POR transcript and protein levels by FR light, as overexpression of PORA can apparently rescue this defect (Sperling et al. 1997). In contrast to wild type, plants carrying a defect in the phyA photoreceptor (phyA) or mutants affected in phytochrome chromophore biosynthesis, such as hy1 and hy2, as well as phyA-signaling mutants such as fhy1, fhy3, and fin2 are resistant to FR-induced killing (van Tuinen et al. 1995; Barnes et al. 1996b; Soh et al. 1998). Furthermore, resembling wild-type seedlings grown in the dark, these mutants display elongated hypocotyls, closed apical hooks, and folded cotyledons in FR-light, and their plastids retain their normal prolamellar body and POR content allowing chloroplast development on subsequent exposure to white light.
This phenotype, which allows the positive selection for individuals with elongated hypocotyls under FR light and resistance to FR-induced killing, was exploited to specifically isolate pat (phytochrome A signal transduction) mutants. We describe the physiological phenotype of the semidominant pat1-1 mutant and the characterization of the PAT1 gene and its gene product. We show that PAT1 is a member of the GRAS protein family and unlike other identified members, it is specific for the phyA-signaling pathway. As the pat1-1 mutant is deficient in most phyA-regulated processes, we suggest that PAT1 acts at an early step of phyA signal transduction.
Results
Mutant screening and isolation of pat mutants
A positive selection for individuals with elongated hypocotyls under FR light and resistance to FR-induced killing was exploited to specifically isolate pat mutants from ∼2000 T3 populations of transfer DNA (T-DNA)-tagged Arabidopsis lines (Koncz et al. 1989). Seeds were sown on a medium without sucrose and vernalized for four days at 4°C in the dark. After 1 hr of white light and 24 hr in dark to induce germination, seeds were irradiated with FR (fluence rates: 4.5 μmoles/m2/sec) light for 84 hr and subsequently shifted into white light. After 3 days in white light (fluence rates: 15 μmoles/m2/sec) seedlings were examined for greening. Surviving plants with longer hypocotyls than wild type were grown to maturity and the progeny was rescreened under both FR and red light (fluence rate: 35 μmoles/m2/sec) conditions. Only plants with long hypocotyls under FR but not under red light conditions were considered to be specifically impaired in phyA signaling.
Physiological and genetical characterization of the pat1-1 mutation
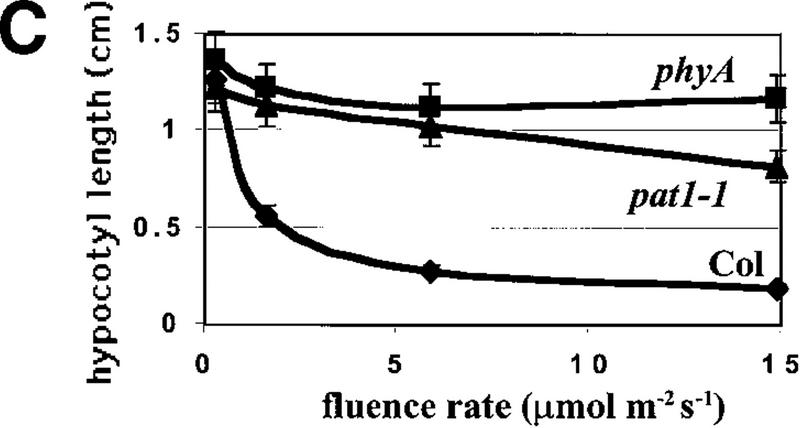
The development in continuous FR light of one of these mutants, pat1-1, showed a strong phenotype resembling that of phyA mutants. Under this condition, pat1-1 seedlings displayed long hypocotyls, unfolded cotyledons, no significant anthocyanin accumulation, and greening after FR light (Fig. 1A,B). In contrast to phyA, pat1-1 showed a partially unfolded hook. Under higher FR fluencies, pat1-1 inhibition of hypocotyl length showed some sensitivity compared to phyA (Fig. 1C). Like phyA, the pat1-1 mutant displayed wild-type hypocotyl lengths under red, blue, and white light and in the dark, indicating a specific lesion in phyA signaling (Table 1). The mutant grew to maturity with no apparent morphological alterations. Immunoblot experiments showed that etiolated pat1-1 seedlings contained similar PHYA levels as etiolated wild-type seedlings (data not shown), suggesting that pat1-1 is impaired in phyA signaling rather than in FR light perception.
Figure 1.
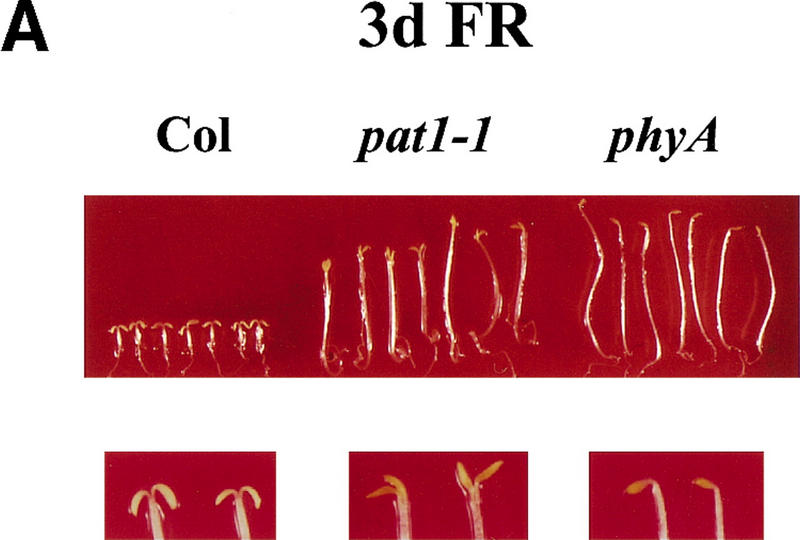
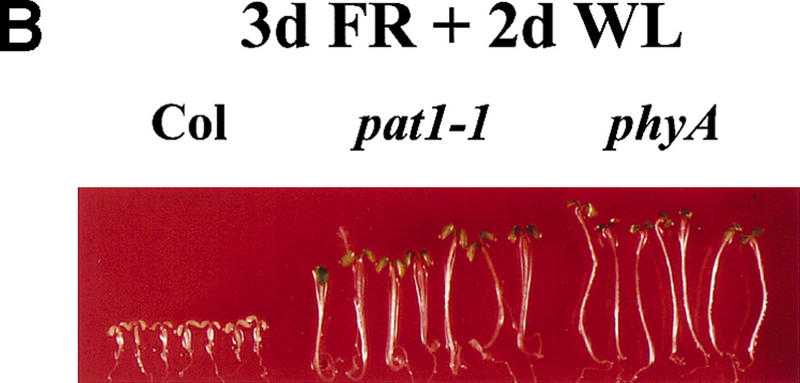
FR light responses in wild-type and mutant seedlings. (A) Seedlings grown for 4 days under continuous FR light (6 μmoles/m2/sec) (top); enlargements of the cotyledons (bottom). (B) After the FR light treatment the same seedlings were transferred for 1 day into white light. (C) Response of the hypocotyl elongation to different fluences of FR light. Wild-type (Col; ⧫), phyA-211 (phyA; █), and pat1-1 (▴) seedlings were grown under the indicated fluences for 4 days. Error bars, s.e.m.
Table 1.
Hypocotyl lengths under different light regimes
|
|
D
|
R light
|
FR light
|
|---|---|---|---|
| WT | 1.51 ± 0.20 | 0.54 ± 0.10 | 0.36 ± 0.05 |
| phyA | 1.49 ± 0.10 | 0.61 ± 0.08 | 1.36 ± 0.17 |
| pat1-1 | 1.55 ± 0.21 | 0.62 ± 0.09 | 1.23 ± 0.14 |
| pat1–1/PAT1 | nd | nd | 0.87 ± 0.05 |
| pat1–1/35S–PAT11 | 1.44 ± 0.19 | 0.67 ± 0.06 | 0.81 ± 0.06 |
| 2 | 1.46 ± 0.20 | 0.55 ± 0.09 | 0.72 ± 0.11 |
| 3 | 1.47 ± 0.09 | 0.52 ± 0.09 | 0.56 ± 0.12 |
| WT/35S-ΔCPAT1 1 | 1.49 ± 0.20 | 0.51 ± 0.08 | 0.89 ± 0.06 |
| 2 | 1.44 ± 0.17 | 0.55 ± 0.05 | 0.78 ± 0.09 |
| 3 | 1.48 ± 0.21 | 0.62 ± 0.06 | 0.72 ± 0.05 |
WT, phyA, pat1-1 (homozygous); pat1–1/PAT1 (heterozygous); three independent lines of complemented mutants (pat1–1/35S–PAT1); and three independent lines of WT overexpressing the 35S-ΔCPAT1 gene (WT/35S–ΔCPAT1) were grown for 4 days either in the dark (D), in red (R) light (35 μmoles/m2/sec) or in FR light (2 μmoles/m2/sec). The experiments were repeated 3 times, each time 20–30 seedlings were measured. Hypocotyl lengths in cm ± standard deviation. (nd), not determined.
Genetic analysis revealed that the mutant phenotype (i.e., elongated hypocotyls in FR light and resistance to FR-induced killing) cosegregated with the hygromycin resistance marker of a single T-DNA insertion. The close linkage of a single T-DNA insertion and the pat1-1 mutation was established by analyzing the cosegregation of the hygromycin-resistance (T-DNA associated) and long-hypocotyl-after-FR phenotypes among progeny of a segregating population of 80 second-generation seedlings. The mutant phenotype proved to be semidominant because heterozygous plants also showed elongated hypocotyls under FR light, although their hypocotyls were shorter than that of a homozygous mutant (Table 1).
Cloning of the PAT1 gene
We utilized the T-DNA tag to isolate the PAT1 gene. A 270-bp genomic sequence adjacent to the left border of the T-DNA insert was amplified by inverse PCR and used as a probe to isolate a full-length PAT1 cDNA from a phage library. The physical linkage between the PAT1 locus and the T-DNA insertion was confirmed by genomic Southern blot analysis and PCR between flanking genomic sequence and T-DNA sequences (data not shown). Two independent cDNA clones were isolated. Both encoded the same full-length ORF (open reading frame) and contained stop codons preceding the putative ATG-start codon in all 3 frames. The size of the longest cDNA is 1792 bp (GenBank accession no. AF153443). The sequence of the PAT1 gene has been determined by the genome sequencing project (GenBank accession no. AB023039) and comparison with the cDNA indicated two introns, one in the 5′-untranslated leader region, the other in the gene. PAT1 is located on chromosome V near the marker mi271. This excluded the possibility that pat1-1 is allelic with any already mapped phyA signaling mutant (fin2, far1, and spa1). Similarly, crosses of pat1-1 with fhy1 and fhy3, whose map positions have not been published, indicated no allelism. Moreover, transformation of fhy1 and fhy3 with 35S-PAT1 did not lead to a wild-type phenotype.
PAT1 is a member of the GRAS family
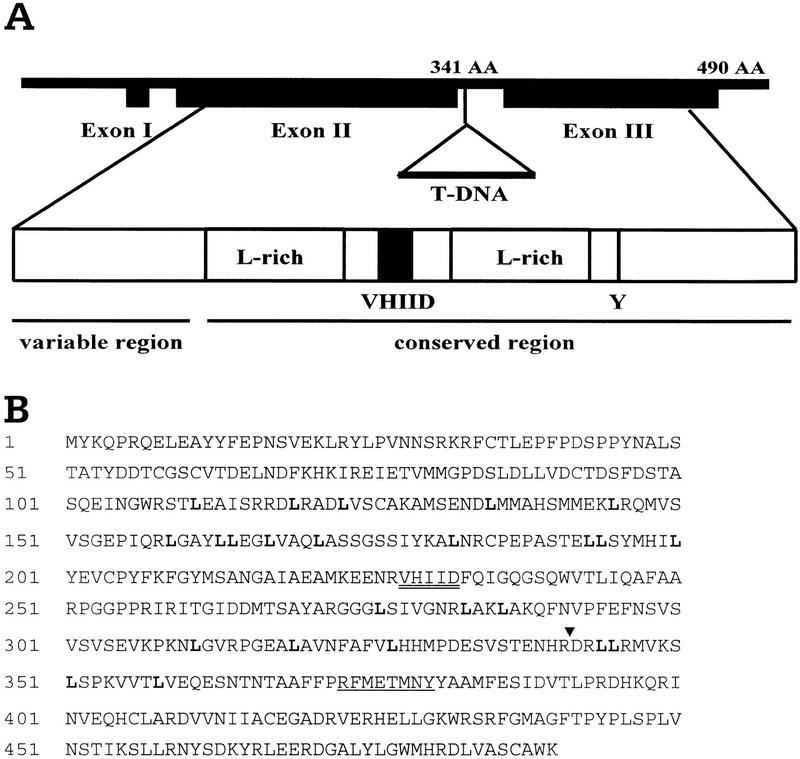
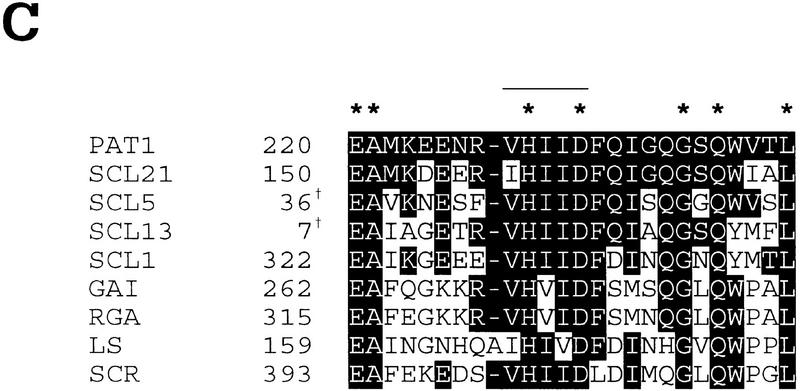
The PAT1 cDNA encodes a predicted protein of 490 amino acid residues (Fig. 2B). The deduced amino acid sequence of the PAT1 protein shows homology to members of the VHIID/GRAS protein family (Pysh et al. 1999), which are characterized by two leucine-rich repeats surrounding a conserved VHIID motif (Fig. 2A,C). The GRAS protein family seems unique to plants and presently consists of >20 members. PAT1 shows the highest homology (45%–70% identity) to the SCL (Scarecrow-like)1/ 5/13 subgroup [GenBank accession nos.are as follows: AF210731 (SCL1), AF036302 (SCL5), AF036308 (SCL13)] of the GRAS family as described in Pysh et al. (1999) and to SCL21 (AF210732). Several mutants disrupted in genes coding for GRAS-family members have been characterized recently: scr (Scarecrow), gai (Gibberellin insensitive), and rga (repressor of ga-1) in Arabidopsis, Ls (Lateral suppressor) in tomato, Rht-B1/Rht-D1 (Reduced height-1) in wheat, and d8 (dwarf-8) in maize (Di Laurenzio et al. 1996; Peng et al. 1997, 1999; Fukaki et al. 1998; Silverstone et al. 1998; Schumacher et al. 1999). GAI, RGA, Rht-B1/Rht-D1, and d8 are negative regulators of gibberellin signal transduction, whereas SCR and Ls act in developmental pattern formation. SCR is involved in a radial patterning and the mutation results in roots and shoots that are missing one cell layer. Conversely, Ls is involved in the initiation of axillary meristems leading to lateral shoot formation.
Figure 2.
Structure of the PAT1 gene and the encoded protein. (A) A schematic representation of the PAT1 gene with its intron/exon structure, its encoded protein, and the insertion of the T-DNA. Structural domains of the protein are indicated. Y(Tyr-379). (B) Deduced amino acid sequence of PAT1 (GenBank accession number AF153443). Leucines in the two L-rich domains are indicated in bold, the VHIID motif is double underlined, putative tyrosine phosphorylation site is underlined [[RK]-x (2,3)-[DE]-x (2,3)-Y] (Patschinsky et al. 1982), and ▾ indicates the disruption of the coding sequence by the T-DNA insertion. (C) Alignment of the VHIID domain of PAT1 compared to those of several GRAS proteins [AF210731 (SCL1), AF036302 (SCL5), AF036308 (SCL13), AF210732 (SCL21); Pysh et al. 1999; Di Laurenzio et al. 1996; Peng et al. 1997; Silverstone et al. 1998; Schumacher et al. 1999]. Residues identical with PAT1 are shown in reverse contrast, identical amino acids are marked with a star. The VHIID motif is indicated with a line. Numbers give residue of first amino acid as referred to in the GenBank. (†) Partial clone.
Specificity of pat1-1 for the phyA-signaling pathway
PAT1 shares the general domain structure with GAI, RGA, and SCR and 25%–30% amino acid identity. To examine possible functional redundancy between PAT1 and other GRAS proteins, we analyzed the growth response of Arabidopsis gai1, rga1, or scr2 mutants under FR light. None of these mutants had elongated hypocotyls under FR light nor were they resistant to FR-induced killing (Fig. 3A). On the other hand, pat1-1 did not display resistance to paclobutrazol (concentration tested: 10−4–10−6 m; data not shown) nor did it exhibit an aberrant root phenotype (Fig. 3B) as described for mutants of the gibberellin pathway gai1 and rga1 or scr, respectively (Di Laurenzio et al. 1996; Peng et al. 1997; Silverstone et al. 1998). Examination of pat1-1 seedlings or adult plants did not uncover any phenotype unrelated to a deficiency in phyA signaling. Thus, PAT1 appears to act specifically in phyA signaling pathway, distinct from those defined by GAI, RGA, Ls, and SCR.
Figure 3.
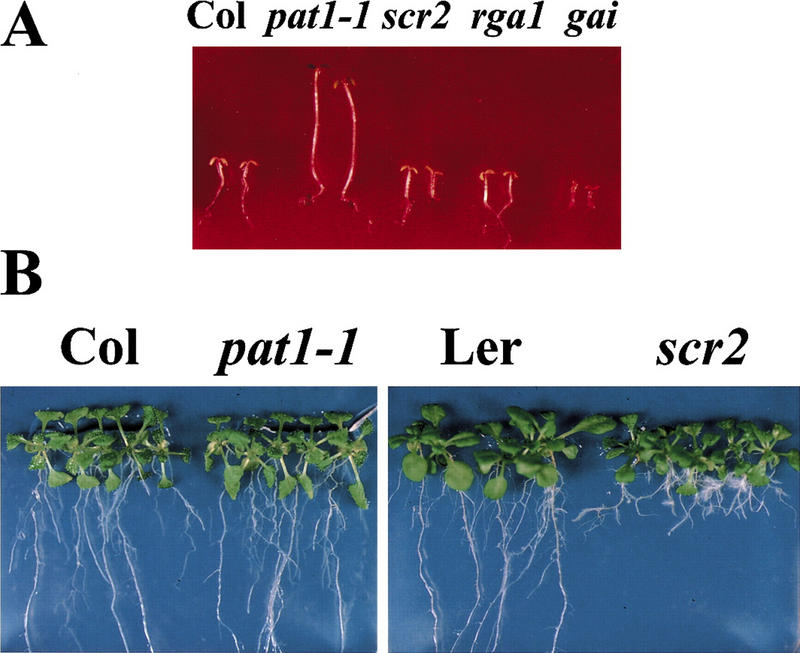
Specificity of mutants disrupted in GRAS family members for their respective pathway. (A) Photographs of Col, pat1-1, scr2, rga1-24, and gai. Seedlings were grown for 4 days under continuous FR light (4.5 μmoles/m2/sec) and then transferred into white light for 1 day. (B) Photographs of three-week-old scr2 and pat1-1 seedlings grown on vertical tissue culture medium under white light conditions with their respective background ecotypes, Landsberg (Ler) and Columbia (Col).
Expression pattern of PAT1
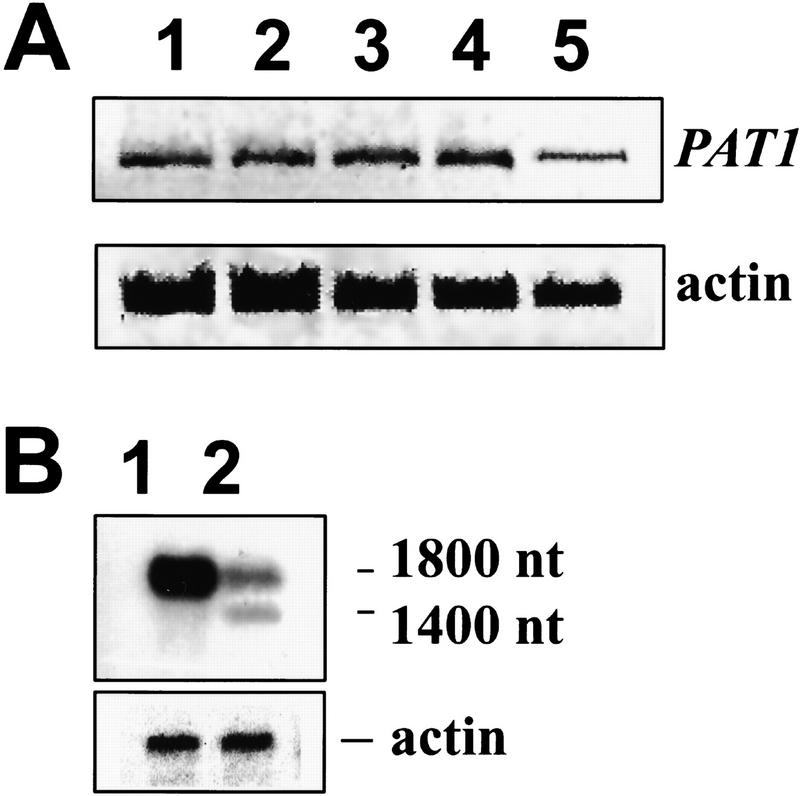
The steady-state level of the PAT1 transcript is very low. Semiquantitative RT–PCR showed that PAT1 is expressed under all light conditions (Fig. 4A). PAT1 expression levels in wild type and phyA mutant plants were shown to be similar, suggesting that PAT1 expression is not regulated by phyA (data not shown). Northern blots with poly(A)+ RNA from wild type revealed one band of ∼1800 nucleotides, corresponding to the size of the cDNA (Fig. 4B). Analysis of transgenic plants carrying a PAT1 promoter–GUS fusion showed expression in all tissues similar to that obtained with 35S–GUS fusion, although at a reduced level (data not shown). Furthermore, the distribution pattern did not vary significantly in seedlings germinated under different light conditions (white, FR, and dark). This result supports the Northern blot data showing low expression of PAT1 under all light conditions.
Figure 4.
PAT1 gene expression analysis. (A) PAT1 expression level under different light conditions detected by RT–PCR. Total RNA was extracted from 5-day-old seedlings grown for 4 days in dark and then transferred into the following light regimes: (1) white light; (2) FR light (3 hr); (3) FR light (18 hr); (4) dark; (5) total RNA was extracted from 3-week-old white-light grown plants. The upper panel shows the RT–PCR reaction performed with PAT1-specific primers, the lower panel with actin-specific primers as a control. FR fluence rate: 4.5 μmoles/m2/sec. (B) Poly(A)+ RNA Northern blot using a 5′ fragment of the PAT1 cDNA as a probe. (1) wild type, (2) pat1-1. Plants for RNA extraction were grown in white light. To confirm equal loading, the Northern was rehybridized with an actin probe.
Expression of a shorter mRNA in the pat1-1 mutant
In the pat1-1 mutant, the T-DNA insertion resides in the second intron disrupting the reading frame at AA 341 (Fig 2A,B). Therefore, we expected that the large T-DNA insertion could interfere with the proper splicing of the PAT1 mRNA. Indeed two different populations of transcripts were observed in pat1-1 accumulating at lower levels than in wild type. In addition to the wild-type PAT1 mRNA (∼1800 nucleotides), a shorter transcript (∼1600 nucleotides) could be detected on poly(A)+ Northern blots when probed with a fragment from the 5′ end but not the 3′ end of PAT1 (Fig. 4B). To confirm this data, we cloned cDNAs corresponding to both transcripts from the pat1-1 mutant. In contrast to the correctly spliced, longer PAT1 transcript, the shorter transcript was not spliced at the second intron. The mutant transcript (mPAT1) contained the first and second exons, 39 nucleotides of the second intron sequence up to the T-DNA integration site, and an additional 98 nucleotides from the left border region of the T-DNA. A cryptic polyadenylation signal in the left border sequence of the T-DNA was used presumably as the mutant transcript was polyadenylated. An in-frame stop codon in the intron sequence predicted that the mutant transcript codes for a truncated protein that contains five additional amino acids (YSFYY) at the carboxyl terminus of AA 341. It is possible that this carboxy-terminally truncated mutant mPAT1 protein functions in a dominant-negative way, thus explaining the semidominant nature of pat1-1 mutation.
Complementation of pat1-1 by transformation
For complementation we expressed the full length wild-type PAT1 cDNA under the control of a 35S promoter in the pat1-1 mutant. Eight independent transgenic lines showed a 35%–55% reduction in hypocotyl lengths under FR light as compared to the pat1-1 mutant (Table 1). These lines also showed reduced ability to green under higher FR fluencies (>2 μmoles/m2/sec). This partial genetic complementation could be explained by two possibilities which are not mutually exclusive: (1) PAT1 was transcribed by the heterologous 35S promoter rather than its cognate promoter; and (2) pat1-1 is a strong dominant-negative mutant.
Overexpression of ΔC-PAT1 phenocopies pat1-1
To examine if a carboxy-terminally truncated PAT1 is the cause for the semidominant phenotype, we addressed whether it was possible to recapitulate the pat1-1 phenotype by overexpression of an appropriately truncated PAT1 in wild-type plants. A 35S–ΔCPAT1 transgene, which is expected to produce a truncated protein (ΔCPAT1: 1–341 AA), was transferred into plants. Five independent transgenic lines showed hypocotyl lengths 2- to 2.5-fold longer than wild type in FR light (Table 1), but wild-type hypocotyl lengths under all other light conditions tested (white, red, and blue light, and darkness). These seedlings were also resistant to the FR-induced killing when grown under lower FR light (fluence rates: 1–2 μmoles/m2/sec), in contrast to control wild-type plants that did not green under these conditions (Fig. 5). Additionally, under these fluencies, the hypocotyl length was only 15%–20% shorter than that of pat1-1. These data demonstrate that expression of the truncated ΔCPAT1 transcript was indeed necessary and sufficient to phenocopy the pat1-1 mutation in blocking phyA signal transduction.
Figure 5.
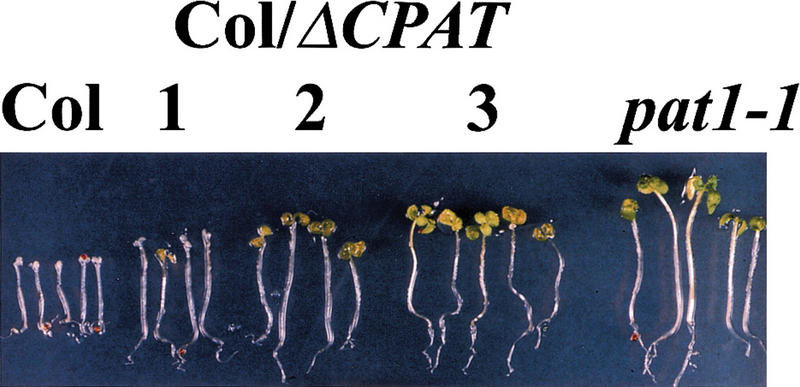
Overexpression of 35S–ΔCPAT1 in wild type phenocopies pat1-1. Seedlings were grown for 4 days under continuous FR light (1.2 μmoles/m2/sec) and subsequently transferred into white light (WL) for 3 days. Three independent transgenic lines are shown with Col and pat1-1 as controls.
Altered expression of several phyA-regulated transcripts
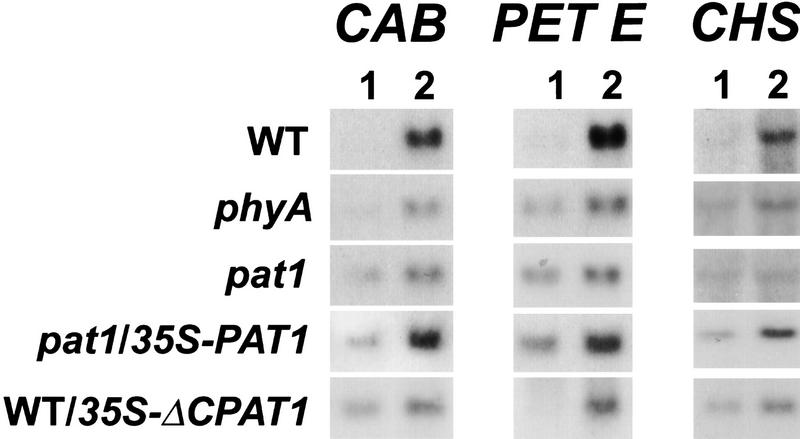
Regulation of hypocotyl elongation and de-etiolation requires fine tuning of expression of genes regulating cell elongation and cell differentiation. Previous work has shown that phyA regulates gene induction by at least three pathways: a cGMP-dependent pathway mediating CHS gene expression, a Ca2+/CaM-dependent pathway that is necessary for CAB and RBCS gene expression, and a third pathway, which requires both cGMP and Ca2+/CaM to induce PET E and PET H gene expression (Neuhaus et al. 1993; Bowler et al. 1994). To locate the site of action of PAT1, we performed Northern blot hybridizations with CHS, CAB, and PET E probes using pat1-1 seedlings grown in dark followed by exposure to FR-light treatment. Control experiments showed that under red light conditions, the expression levels were similar to those in wild type, thus confirming the specificity for phyA (data not shown). Figure 6 shows that the expression levels in FR light of these marker genes were similarly reduced in both pat1-1 and phyA mutants compared with wild type. As in phyA, expression of PORA is not repressed in pat1-1 (data not shown). This correlates well with electron microscopy studies indicating that, as in phyA, the prolamellar body is not degraded by FR light in pat1-1 (data not shown). Furthermore, expression of the wild-type PAT1 transcript by the 35S promoter in the pat1-1 mutant partially restored the induction of the CHS, CAB, and PET E genes by FR, confirming the results of genetic complementation studies defined by hypocotyl length. Conversely, overexpression of the truncated ΔCPAT1 transcript using the 35S promoter in wild type reduced the induction of CHS, CAB, and PET E gene expression in FR light as compared to nontransformed control plants (Fig. 6).
Figure 6.
Expression studies of three different phyA-regulated genes CHS, CAB, and PET E. WT, phyA, pat1-1, complemented pat1-1 (pat1-1/35S-PAT1) and WT overexpressing a 35S–ΔCPAT1 transgene (WT/ΔCPAT1) seedlings were grown under continuous dark for 4 days (1) and induced by 3 hr of FR light (2). Seven μg of total RNA were loaded on each lane and equal loading was confirmed using an 18S DNA probe.
Cytoplasmic localization of PAT1
In contrast to RGA, GAI, and SCR, all of which contain nuclear localization signals (NLS), no putative NLS is found in PAT1 (and SCL1/5/13/21) and Ls. To investigate the subcellular localization of PAT1, Arabidopsis was transformed with a PAT1–GFP fusion gene under the control of the 35S promoter. Analysis of roots of transgenic plants revealed that both the PAT1–GFP fusion protein and the control GFP protein were distributed throughout the cytoplasm and the nucleus, although the nuclear abundance of PAT1–GFP was less than that of GFP alone. This indicates a cytoplasmic localization of PAT1 (Fig. 7). To demonstrate that the PAT1–GFP fusion is functional, we transformed Arabidopsis with a 35S-ΔCPAT1–GFP transgene. Transgenic plants carrying this construct phenocopied the pat1-1 mutant demonstrating that the fusion protein was indeed active (data not shown). Moreover, microscopic analysis of the ΔCPAT1–GFP transgenic plants revealed a cytoplasmic localization of the fusion protein similar to the PAT1–GFP fusion. This suggests that the observed cytoplasmic localization is due to a functional fusion of PAT1 with GFP and rules out that the PAT1 moiety was selectively degraded in the fusion protein. Cytoplasmic localization of the fusion proteins was also observed when the PAT1–GFP and ΔCPAT1–GFP fusion genes were introduced into onion epidermal cells using a particle gun (data not shown).
Figure 7.
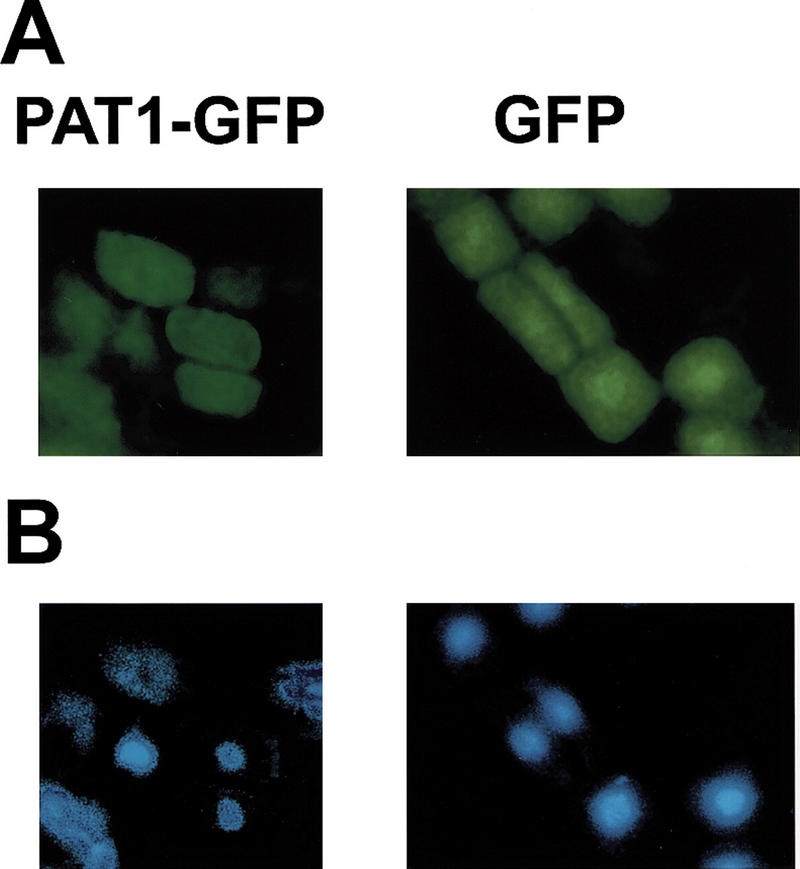
Subcellular localization of PAT1 in transgenic plants. A 35S–PAT1–GFP fusion gene (PAT1–GFP) and a control 35S-GFP gene (GFP) were introduced into wild type by Agrobacterium tumefaciens-mediated vacuum-infiltration. (A) The root-tips of transgenic plants were analyzed for GFP signal. (B) Nuclei in the same cells as in A were stained with DAPI (4′,6′-diamidino-2-phenylindole).
Discussion
Our results suggest that PAT1 is specifically involved in phyA-signal transduction and acts as an early signaling component. Several lines of evidence support this notion. The pat1-1 mutant is deficient or strongly reduced in all FR high-irradiance responses tested, including physiological markers such as hypocotyl length, cotyledon unfolding, greening after FR light, and anthocyanin accumulation as well as phyA-inducible gene expression. Nevertheless, there appears to be residual phyA signaling in pat1-1 as the apical hooks of mutant seedlings can partially unfold and hypocotyl elongation is only partially inhibited under high FR fluencies (Fig. 1A,C). Futhermore, FR induction of gene expression is not completely inhibited. In the dark and under all other light conditions (white, red, and blue) we found no apparent difference in morphology and gene expression levels between pat1-1 and wild type. Because pat1-1 appears to contain wild-type levels of phyA photoreceptor, we conclude that the phyA-signal-transduction pathway must be inhibited.
PAT1 appears to act at an early step of the phyA-signaling pathway before divergence of the three branches defined earlier by pharmacological studies (Neuhaus et al. 1993; Bowler at al. 1994) as the expression pattern of all marker genes tested is reduced or abolished. Similar results were reported for fin2, although in this mutant CAB and CHS expression levels and anthocyanin content are not as reduced as in pat1-1 (Soh et al. 1998). In contrast, fhy1 was shown to be affected mainly in the cGMP-dependent pathway for CHS activation (Barnes et al. 1996b). We note that although pat1-1, fhy1, fhy3, and fin2 have very long hypocotyls under FR light and are resistant to FR-induced killing, they differ in their gene expression patterns. This result suggests that these mutants define different branches of the phyA-phototransduction network.
By sequence homology, PAT1 belongs to a plant-specific protein family named VHIID or GRAS (Pysh et al. 1999). Whereas the carboxyl termini of GRAS proteins are conserved, their amino termini vary in length and sequence, and may determine the specificity of these regulatory proteins. In fact, the amino-terminal sequences of all proteins involved in gibberellin signaling show a high degree of homology amongst themselves but not to PAT1, SCR, and Ls. As compared to their wild-type counterparts, GAI, Rht-B1/Rht-D1, and d8 contain deletions in their amino-terminal sequences leading to a dwarf phenotype in the respective mutants (Peng et al. 1999). The amino terminus of PAT1 does not show significant sequence homology to any other GRAS protein identified thus far. Like other GRAS proteins, the conserved carboxy-terminal domain of PAT1 contains two leucine-rich domains (Fig. 2A,B), potential targets for protein–protein interactions, as well as a highly conserved Tyr (379) residue that is part of a consensus phosphorylation site [[RK]-x (2,3)-[DE]-x (2,3)-Y; Patschinsky et al. 1982], conserved in most members of the GRAS family. To date, the evidence for tyrosine phosphorylation in plants is limited but several proteins that are phosphorylated on tyrosine residues have recently been identified (Barizza et al. 1999; Guillen at al. 1999). Recently, Peng et al. (1999) proposed that the carboxyl terminus of the GA-related proteins contains an SH2 domain and this region overlaps with the consensus site for tyrosine phosphorylation. The amino acids crucial for an SH2 domain are less conserved in PAT1 as compared to GAI, RGA, Rht-B1/Rht-D1, and d8, thereby preventing a clear identification.
The sequence homologies of PAT1 to proteins that are involved in other signaling pathways such as gibberellin and cell division prompted us to test if pat1-1 was affected in these pathways. Sensitivity to paclobutrazol and the normal adult phenotype of pat1-1 plants clearly rule out the involvement of PAT1 in these pathways.
The simplest explanation of the pat1-1 phenotype is that the PAT1 protein acts as a positive regulator of the phyA-signaling pathway. Two lines of evidence suggest that a truncated PAT1 protein, containing the first 341 amino acids, can act as a dominant-negative component. First, transformation of the pat1-1 mutant with the full-length cDNA can only partially reverse the dominant mutant phenotype, defined by enhanced hypocotyl elongation and reduced induction of gene expression in FR light. Second, overexpression of the truncated transcript in the wild-type phenocopies the pat1-1 mutant. Taken together, these results suggest that the semidominant nature of pat1-1 can be best explained by the nonproductive binding of the truncated PAT1 protein to PAT1 interacting partners, thus inhibiting signal transduction. Proper PAT1 function thus appears to require a carboxy-terminal protein domain. As PAT1 is a member of the GRAS family which includes at least four closely related proteins (SCL1, 5, 13, and 21), partial functional redundancy might occur. The truncated mPAT1 might block signaling of several related proteins, therefore leading to a more severe phenotype than a single knockout mutant. This might explain why recessive pat1 mutations were not recovered in previous screens for phyA-signaling mutants. A similar scenario of functional redundancy has been proposed for GAI and RGA which share substantial sequence homologies and might have overlapping functions in the gibberellin signal transduction pathway. Knockout mutants show a weak gibberellin-deficient phenotype whereas the extremely dwarfed gai mutant is caused by an amino-terminal deletion in the protein. Functional redundancy might also account for the leaky phenotype of the phyA-signaling mutant far1 as four genes homologous to FAR1 were isolated that are functional in the far1 mutant (Hudson et al. 1999).
Besides PAT1, other components that most likely act as positive components of phyA-signal transduction are FHY1, FHY3, FIN2, and FAR1 (Whitelam et al. 1993; Hoecker et al. 1998; Soh et al. 1998; Hudson et al. 1999) because their respective loss-of-function mutants have reduced sensitivity to FR light. So far only FAR1 has been characterized at the molecular level and it encodes a nuclear-localized protein with a putative coiled-coil domain (Hudson et al. 1999). Under FR light, the far1 mutant has an elongated hypocotyl and reduced anthocyanin levels. Nevertheless, far1 retains some sensitivity to FR light since its hypocotyl length can be inhibited by higher FR fluencies. This FR sensitivity of far1 is more pronounced as compared to the pat1-1 mutant.
SPA1 is a negatively acting nuclear WD-repeat protein that represses either phyA signaling itself or inhibits upstream activators of phyA signaling (Hoecker at al. 1999). The spa1 mutation increases the responsiveness of seedlings to continuous FR light, as indicated by an enhanced de-etiolation in FR light, an increased FR-induced anthocyanin accumulation, and a higher sensitivity to FR-induced killing. Whereas phyA regulates SPA1 at the transcriptional level, our findings concerning PAT1 suggest that posttranslational modifications might account for the regulatory capacity of this cytoplasmic signaling component.
Recent reports demonstrated that both phyA and phyB can translocate from the cytoplasm into the nucleus in response to light (Sakamoto and Nagatani 1996; Kircher et al. 1999; Yamaguchi et al. 1999). Furthermore, several signaling intermediates, such as SPA1 (Hoecker et al. 1999), FAR1 (Hudson et al. 1999) and the phyA/phyB-interacting protein PIF3 (Ni et al. 1998, 1999), are localized in the nucleus. Conversely, cytoplasmic localization of PAT1 and of the phyA/phyB-interacting proteins PSK1 and NDPK2, and the involvement of putative heterotrimeric GTP-binding proteins, Ca2+/CaM and cGMP in phyA signaling suggest that important early signaling events occur in the cytoplasm. PKS1, which negatively regulates the action of phyB, has been proposed to be important for cytoplasmic retention of phyA and its phosphorylation by phyA might cause phyA to move to the nucleus. At present, it is not clear whether PAT1 might participate in such a role, although PAT1 does not appear to act downstream of the phyA-interacting proteins identified so far as their loss-of-function lines show a less pronounced phenotype than pat1-1.
In summary, we conclude that the PAT1 gene product is a positively acting cytoplasmic component shown to operate specifically downstream of photopercection by phyA. The severity of the pat1-1 phenotype suggests that PAT1 acts at an early stage of phyA signaling cascade. Our findings not only open the way for further exploration of the functions and modes of action of GRAS gene family members, but underscores the importance of both cytoplasmic as well as nuclear events in phytochrome action.
Materials and methods
Plant material
T-DNA lines were raised in Arabidopsis thaliana ecotype Columbia (Col-0) as described in Koncz et al. (1989). A phyA-null mutant in ecotype Columbia (phyA-211) was used as a control. fhy1 and fhy3 were kindly provided by Garry Whitelam (University of Leicester, UK), rga1-23 by Tai-Ping Sun (Duke University, Durham, NC), and scr2, gai, and PhyA-211 by the Arabidopsis Biological Resource Center (Ohio State University, Columbus).
Growth conditions and light sources
Surface-sterilized seeds were sown on 1× Murashige and Skoog media plates (GIBCO BRL) without sucrose and vernalized for 4 days at 4°C in dark. After 1 hr of white light and 24 hr in dark at 22°C, plates with the seeds were transferred for 4 days to the appropriate light conditions at 22°C. Fluence rates were as follows, if not otherwise indicated: (FR) 4.5 μmoles/m2/sec; (red) 35 μmoles/m2/sec; (white) 15 μmoles/m2/sec. For Nothern-blot analysis 5-day-old etiolated seedlings were kept either in continuous darkness or transferred into FR light for 3 hr.
FR and red light were supplied by LED light sources (Quantum Devices, Barnveld, WI). The FR light was filtered additionally through one layer of plexiglas (model 067894; West Lake Plastics, Lenni, PA). The source for the white light was cool-white fluorescent lamps (Osram Sylvania, Danvers, MA).
Genetic analysis
The close linkage of a single T-DNA insertion and the pat1-1 mutation was established by crossing pat1-1 to Col and analyzing the cosegregation of the hygromycin-resistance (T-DNA associated) and long-hypocotyl-after-FR phenotypes among the progeny of a segregating population of 80 second-generation seedlings.
Extraction of DNA and RNA
Plant genomic DNA was isolated using the Genomic-tip100-Kit following the plant-specific protocol of the manufacturer (Qiagen Inc., Chatsworth, CA). Total RNA was extracted using the RNeasy Plant mini kit (Qiagen Inc., Chatsworth, CA) and 1 μg total RNA was used to isolate poly(A)+ RNA with an Oligotex kit (Qiagen Inc., Chatsworth, CA).
Isolation of PAT1 cDNA and sequence analysis
To clone the genomic DNA flanking the T-DNA insertion in pat1-1, 200 ng of genomic DNA from the mutant were digested with ClaI and religated in 200 μl with T4 ligase (New England Biolabs Inc., Beverly, MA). To perform inverse PCR (IPCR) two primers within the left border of the T-DNA were designed to amplify the DNA adjacent of the tag (LB1: 5′-CGCTGCGGACATCTACATT-3′; LB2: 5′-GATCCGTCGTATTTATAGGCG-3′). For reamplification, a nested set of primers was used (LB3: 5′-CTCCATATTGACCATCATACTC-3′; LB4: 5′-GACGTGTCTACATTCACGTC-3′). PCR was performed with Takara LA Taq (Panvera Corp., Madison, WI) according to the manufacturer's protocols. A 270-bp long fragment adjacent to the left border of the T-DNA was isolated, cloned into pGEM vector (Promega, Madison, WI), and used to screen a phage-based Arabidopsis (Col) cDNA library. Two different cDNA clones were isolated; one was 10 nucleotides longer on the 5′ end. Both encoded the same full-length ORF and contained stop codons preceding the putative ATG-start codon in all three frames. Comparison with the genomic sequence indicated two introns, one in the 5′-untranslated leader region, the other in the gene. The size of the longest cDNA is 1792 bp (GenBank accession no. AF153443).
Database searches were performed at the U.S. National Center for Biotechnology Information (Bethesda, MD) with the BLAST program (Altschul et al. 1990) or with the WU-BLAST 2.0 at Stanford University, CA. The amino acid sequence alignment was performed with the MegAlign program (DNASTAR, Madison, WI) using the Clustal W method.
Expression analysis
PAT1 transcription levels were determined by reverse transcription (RT)–PCR analysis of total RNA. RNA (1 μg) was used in each RT–PCR following the manufacturer's protocol (Titan One Tube RT–PCR System, Roche Molecular Biochemicals, Indianapolis, IN). PCR amplification was performed for a total of 20 cycles as follows: denaturation at 94°C for 45 sec, annealing at 60°C for 1 min, and extension at 68°C for 2 min. The final extension was carried out at 68°C for 10 min, and the reaction was then stopped at 4°C. Primers used for amplification of PAT1 were a 5′ primer upstream of the second intron (5′-GGTATCGGTGTCAGTTTCCGA-3′) and a 3′ primer downstream of the second intron (5′-CCATCACACTAGAGAAATGTCACTG-3′) resulting in a 610-nucleotide fragment. Primers used for amplification of actin (actin-1; GenBank accession no. M20016) were 5′-GATGGTGAAGACATTCAACCTCTTG-3′ and 5′-CACATACATAGCAGGGGCATTG-3′ resulting in a 400-nucleotide fragment if the RNA was spliced. The primer pairs were used in separate reactions to avoid primer competition but a common master mix was prepared to ensure equal distribution of the RNA. The PCR products were separated by gel electrophoresis on 1.2% agarose gels, blotted, and hybridized with a probe for detection of PAT1.
For Northern blot analysis, equal amounts of poly(A)+ RNA or total RNA were size-fractionated through a MOPS–formaldehyde gel and subsequently transferred to a nylon membrane. After hybridization in 50% formamide with random prime-labeled fragments, membranes were washed with 0.1× saline sodium citrate and 0.1% SDS at 45°C and the bands quantified by a PhosphorImager (Molecular Dynamics) using actin or 18S rDNA as internal standards, respectively. As a probe for PAT1 either an amino-terminal (HindIII fragment 63–857 nucleotides) or a carboxy-terminal (PCR fragment 1114–1424 nucleotides) part of the PAT1 cDNA were used. CHS, CAB, and PET E probes were described in Barnes et al. (1996b).
Plant transformation
Plasmids that were used to generate transgenic plants were introduced into the Agrobacterium strain ABI or EHA105. Homozygous pat1-1 mutants or Col-0 plants were used for in planta transformation using vacuum infiltration after Clough and Bent (1998).
Constructs for complementation
For transformation, a binary vector carrying a kanamycin resistance gene containing a 35S-PAT1-NOS 3′ or a 35S–ΔCPAT1-NOS 3′ gene cassette was used. The full-length cDNA was used for 35S-PAT1-NOS whereas ΔC-PAT1 was generated by using primers that amplified the coding region of PAT1 from the ATG-start codon (5′-CGGTCGACATGTACAAGCAGCCTAGACAAGA-3′), adding a SalI site, to the end of the second exon (5′-CGGATATCAGGTACCGCGGTGATTCTCGGTGCTACGC-3′), adding a TGA-stop codon and the restriction sites EcoRV and KpnI. Constructs were checked for mutations by sequencing. The T1 transformants were selected on kanamycin-containing medium, grown to maturity and selfed. Twenty independent lines were generated for each construct and those with the strongest phenotype were analyzed. The presence of the transgenic mRNA was verified with Northern blots.
Analysis of PAT1-promoter activity in transgenic plants
995-bp 5′ of the ATG-start codon of the PAT1 gene were amplified by PCR from the genomic DNA with primers (5′-AAGCTTGTGGCTCTGGTTTGATTATGTTTAGGGT-3′ adding a HindIII site and 5′-TCTAGACTAGTCACTTCAATGATCTGCACAATAAC-3′ adding a XbaI site) and cloned in front of the GUS gene in the pBI101 vector. Col-0 plants were transformed with this construct and the control construct containing the 35S promoter in front of the GUS gene. Four-day-old seedlings of the T2 generation, which were germinated either in white light, FR light or in dark, were incubated in a staining solution (2 mm X-Gluc in 0.1 m Na-phosphate buffer at pH 7 with 0.5% DMSO) for 5 min under vacuum followed by 5 hr at 37°C. The tissues where incubated in 70% ethanol to remove the chlorophyll and observed using a microscope.
Analysis of GFP localization
The GFP gene (Kost et al. 1998) was fused to the carboxyl terminus of the PAT1 cDNA which was generated by using primers that amplified the coding region from the ATG-start codon (5′-CGGTCGACATGTACAAGCAGCCTAGACAAGA-3′), adding a SalI site to the TGA-stop codon (5′-ATGGTACCTTTCCAAGCACACGGAGCAACC-3′), and adding a KpnI site while deleting the stop codon itself. The ΔCPAT1–GFP fusion was cloned in the same way using only the following primer to generate the 3′ end of ΔCPAT1: 5′- CGGATATCAGGTACCGCGGTGATTCTCGGTGCTCACGC-3′. After transferring the GFP-fusion cassettes into a binary vector, wild-type plants were transformed. T1 transformants were selected on kanamycin-containing medium and examined using an Axioskop microscope (Carl Zeiss Inc., Thornwood, NY) to visualize GFP fluorescence.
Acknowledgments
We thank Georghios Stratis and Li-Fang Huang for excellent technical assistance and Simon G. Møller, Peter Hare, Maria L. Ballesteros, and Tim Kunkel for critical reading of the manuscript, Dr. Tai-Ping Sun for rga1-23 seeds, Dr. Garry Whitelam for fhy1 and fhy3 seeds, and the Arabidopsis Biological Resource Center in Ohio for providing scr2, gai1, and phyA-211 seeds. C.B. was supported by a fellowship from the DFG (Deutsche Forschungsgemeinschaft) and the Charles H. Revson Foundation. These studies were supported by the NIH grant GM-44640.
The publication costs of this article were defrayed in part by payment of page charges. This article must therefore be hereby marked “advertisement” in accordance with 18 USC section 1734 solely to indicate this fact.
Footnotes
E-MAIL chua@rockvax.rockefeller.edu; FAX (212) 327-8327.
References
- Altschul SF, Gish W, Miller W, Myers EW, Lipman DJ. Basic local alignment search tool. J Mol Biol. 1990;215:403–410. doi: 10.1016/S0022-2836(05)80360-2. [DOI] [PubMed] [Google Scholar]
- Barizza E, Lo Schiavo F, Terzi M, Filippini F. Evidence suggesting protein tyrosine phosphorylation in plants depends on the developmental conditions. FEBS Lett. 1999;447:191–194. doi: 10.1016/s0014-5793(99)00272-0. [DOI] [PubMed] [Google Scholar]
- Barnes SA, Nishizawa NK, Quaggio RB, Whitelam GC, Chua NH. Far-red light blocks greening of Arabidopsis seedlings via a phytochrome A-mediated change in plastid development. Plant Cell. 1996a;8:601–615. doi: 10.1105/tpc.8.4.601. [DOI] [PMC free article] [PubMed] [Google Scholar]
- Barnes SA, Quaggio RB, Whitelam GC, Chua NH. fhy1 defines a branch point in phytochrome A signal transduction pathways for gene expression. Plant J. 1996b;10:1155–1161. doi: 10.1046/j.1365-313x.1996.10061155.x. [DOI] [PubMed] [Google Scholar]
- Bowler C, Neuhaus G, Yamagata H, Chua NH. Cyclic GMP and calcium mediate phytochrome phototransduction. Cell. 1994;77:73–81. doi: 10.1016/0092-8674(94)90236-4. [DOI] [PubMed] [Google Scholar]
- Canton FR, Quail PH. Both phyA and phyB mediate light-imposed repression of PHYA gene expression in Arabidopsis. Plant Physiol. 1999;121:1207–1216. doi: 10.1104/pp.121.4.1207. [DOI] [PMC free article] [PubMed] [Google Scholar]
- Choi G, Yi H, Lee J, Kwon YK, Soh MS, Shin B, Luka Z, Hahn TR, Song PS. Phytochrome signalling is mediated through nucleoside diphosphate kinase 2. Nature. 1999;401:610–613. doi: 10.1038/44176. [DOI] [PubMed] [Google Scholar]
- Clough SJ, Bent AF. Floral dip: A simplified method for Agrobacterium-mediated transformation of Arabidopsis thaliana. Plant J. 1998;16:735–743. doi: 10.1046/j.1365-313x.1998.00343.x. [DOI] [PubMed] [Google Scholar]
- Deng XW, Quail PH. Signalling in light-controlled development. Semin Cell Dev Biol. 1999;10:121–129. doi: 10.1006/scdb.1999.0287. [DOI] [PubMed] [Google Scholar]
- Di Laurenzio L, Wysocka-Diller J, Malamy JE, Pysh L, Helariutta Y, Freshour G, Hahn MG, Feldmann KA, Benfey PN. The SCARECROW gene regulates an asymmetric cell division that is essential for generating the radial organization of the Arabidopsis root. Cell. 1996;86:423–433. doi: 10.1016/s0092-8674(00)80115-4. [DOI] [PubMed] [Google Scholar]
- Fankhauser C, Chory J. Light control of plant development. Annu Rev Cell Dev Biol. 1997;13:203–229. doi: 10.1146/annurev.cellbio.13.1.203. [DOI] [PubMed] [Google Scholar]
- Fankhauser C, Yeh KC, Lagarias JC, Zhang H, Elich TD, Chory J. PKS1, a substrate phosphorylated by phytochrome that modulates light signaling in Arabidopsis. Science. 1999;284:1539–1541. doi: 10.1126/science.284.5419.1539. [DOI] [PubMed] [Google Scholar]
- Fukaki H, Wysocka-Diller J, Kato T, Fujisawa H, Benfey PN, Tasaka M. Genetic evidence that the endodermis is essential for shoot gravitropism in Arabidopsis thaliana. Plant J. 1998;14:425–430. doi: 10.1046/j.1365-313x.1998.00137.x. [DOI] [PubMed] [Google Scholar]
- Furuya M. Molecular properties and biogenesis of phytochrome I and II. Adv Biophys. 1989;25:133–167. doi: 10.1016/0065-227x(89)90006-3. [DOI] [PubMed] [Google Scholar]
- ————— Phytochromes: Their molecular species, gene families, and functions. Annu Rev Plant Physiol Plant Mol Biol. 1993;44:617–645. [Google Scholar]
- Guillen G, Valdes-Lopez V, Noguez R, Olivares J, Rodriguez-Zapata LC, Perez H, Vidali L, Villanueva MA, Sanchez F. Profilin in Phaseolus vulgaris is encoded by two genes (only one expressed in root nodules) but multiple isoforms are generated in vivo by phosphorylation on tyrosine residues. Plant J. 1999;19:497–508. doi: 10.1046/j.1365-313x.1999.00542.x. [DOI] [PubMed] [Google Scholar]
- Hennig L, Buche C, Eichenberg K, Schäfer E. Dynamic properties of endogenous phytochrome A in Arabidopsis seedlings. Plant Physiol. 1999;121:571–577. doi: 10.1104/pp.121.2.571. [DOI] [PMC free article] [PubMed] [Google Scholar]
- Hoecker U, Xu Y, Quail PH. SPA1: a new genetic locus involved in phytochrome A-specific signal transduction. Plant Cell. 1998;10:19–33. doi: 10.1105/tpc.10.1.19. [DOI] [PMC free article] [PubMed] [Google Scholar]
- Hoecker U, Tepperman JM, Quail PH. SPA1, a WD-repeat protein specific to phytochrome A signal transduction. Science. 1999;284:496–499. doi: 10.1126/science.284.5413.496. [DOI] [PubMed] [Google Scholar]
- Hudson M, Ringli C, Boylan MT, Quail PH. The FAR1 locus encodes a novel nuclear protein specific to phytochrome A signaling. Genes & Dev. 1999;13:2017–2027. doi: 10.1101/gad.13.15.2017. [DOI] [PMC free article] [PubMed] [Google Scholar]
- Kircher S, Kozma-Bognar L, Kim L, Adam E, Harter K, Schäfer E, Nagy F. Light quality and quantity dependent nuclear import of phytochrome-A and B. Plant Cell. 1999;11:1445–1456. doi: 10.1105/tpc.11.8.1445. [DOI] [PMC free article] [PubMed] [Google Scholar]
- Koncz C, Martini N, Mayerhofer R, Koncz-Kalman Z, Korber H, Redei GP, Schell J. High-frequency T-DNA-mediated gene tagging in plants. Proc Natl Acad Sci. 1989;86:8467–8471. doi: 10.1073/pnas.86.21.8467. [DOI] [PMC free article] [PubMed] [Google Scholar]
- Kost B, Spielhofer P, Chua NH. A GFP-mouse talin fusion protein labels plant actin filaments in vivo and visualizes the actin cytoskeleton in growing pollen tubes. Plant J. 1998;16:393–401. doi: 10.1046/j.1365-313x.1998.00304.x. [DOI] [PubMed] [Google Scholar]
- Lissemore JL, Quail PH. Rapid transcriptional regulation by phytochrome of the genes for phytochrome and chlorophyll a/b-binding protein in Avena sativa. Mol Cell Biol. 1988;8:4840–4850. doi: 10.1128/mcb.8.11.4840. [DOI] [PMC free article] [PubMed] [Google Scholar]
- Neff MM, Fankhauser C, Chory J. Light: An indicator of time and place. Genes & Dev. 2000;14:257–271. [PubMed] [Google Scholar]
- Neuhaus G, Bowler C, Kern R, Chua NH. Calcium/calmodulin-dependent and -independent phytochrome signal transduction pathways. Cell. 1993;73:937–952. doi: 10.1016/0092-8674(93)90272-r. [DOI] [PubMed] [Google Scholar]
- Ni M, Tepperman JM, Quail PH. PIF3, a phytochrome-interacting factor necessary for normal photoinduced signal transduction, is a novel basic helix-loop-helix protein. Cell. 1998;95:657–667. doi: 10.1016/s0092-8674(00)81636-0. [DOI] [PubMed] [Google Scholar]
- Ni M, Tepperman JM, Quail PH. Binding of phytochrome B to its nuclear signalling partner PIF3 is reversibly induced by light. Nature. 1999;400:781–784. doi: 10.1038/23500. [DOI] [PubMed] [Google Scholar]
- Patschinsky T, Hunter T, Esch FS, Cooper JA, Sefton BM. Analysis of the sequence of amino acids surrounding sites of tyrosine phosphorylation. Proc Natl Acad Sci. 1982;79:973–977. doi: 10.1073/pnas.79.4.973. [DOI] [PMC free article] [PubMed] [Google Scholar]
- Peng J, Carol P, Richards DE, King KE, Cowling RJ, Murphy GP, Harberd NP. The Arabidopsis GAI gene defines a signaling pathway that negatively regulates gibberellin responses. Genes & Dev. 1997;11:3194–3205. doi: 10.1101/gad.11.23.3194. [DOI] [PMC free article] [PubMed] [Google Scholar]
- Peng J, Richards DE, Hartley NM, Murphy GP, Devos KM, Flintham JE, Beales J, Fish LJ, Worland AJ, Pelica F, et al. “Green revolution” genes encode mutant gibberellin response modulators. Nature. 1999;400:256–261. doi: 10.1038/22307. [DOI] [PubMed] [Google Scholar]
- Pysh LD, Wysocka-Diller JW, Camilleri C, Bouchez D, Benfey PN. The GRAS gene family in Arabidopsis: Sequence characterization and basic expression analysis of the SCARECROW-LIKE genes. Plant J. 1999;18:111–119. doi: 10.1046/j.1365-313x.1999.00431.x. [DOI] [PubMed] [Google Scholar]
- Quail PH, Boylan MT, Parks BM, Short TW, Xu Y, Wagner D. Phytochromes: Photosensory perception and signal transduction. Science. 1995;268:675–680. doi: 10.1126/science.7732376. [DOI] [PubMed] [Google Scholar]
- Sakamoto K, Nagatani A. Nuclear localization activity of phytochrome B. Plant J. 1996;10:859–868. doi: 10.1046/j.1365-313x.1996.10050859.x. [DOI] [PubMed] [Google Scholar]
- Sato N. Nucleotide sequence and expression of the phytochrome gene in Pisum sativum: Differential regulation by light of multiple transcripts. Plant Mol Biol. 1988;11:697–710. doi: 10.1007/BF00017469. [DOI] [PubMed] [Google Scholar]
- Schumacher K, Schmitt T, Rossberg M, Schmitz G, Theres K. The Lateral suppressor (Ls) gene of tomato encodes a new member of the VHIID protein family. Proc Natl Acad Sci. 1999;96:290–295. doi: 10.1073/pnas.96.1.290. [DOI] [PMC free article] [PubMed] [Google Scholar]
- Silverstone AL, Ciampaglio CN, Sun TP. The Arabidopsis RGA gene encodes a transcriptional regulator repressing the gibberellin signal transduction pathway. Plant Cell. 1998;10:155–169. doi: 10.1105/tpc.10.2.155. [DOI] [PMC free article] [PubMed] [Google Scholar]
- Soh MS, Hong SH, Hanzawa H, Furuya M, Nam HG. Genetic identification of FIN2, a far red light-specific signaling component of Arabidopsis thaliana. Plant J. 1998;16:411–419. doi: 10.1046/j.1365-313x.1998.00307.x. [DOI] [PubMed] [Google Scholar]
- Sperling U, van Cleve B, Frick G, Apel K, Armstrong GA. Overexpression of light-dependent PORA or PORB in plants depleted of endogenous POR by far-red light enhances seedling survival in white light and protects against photooxidative damage. Plant J. 1997;12:649–658. doi: 10.1046/j.1365-313x.1997.00649.x. [DOI] [PubMed] [Google Scholar]
- van Tuinen A, Kerckhoffs LH, Nagatani A, Kendrick RE, Koorneef M. Far-red light-insensitive, phytochrome A-deficient mutants of tomato. Mol Gen Genet. 1995;246:133–141. doi: 10.1007/BF00294675. [DOI] [PubMed] [Google Scholar]
- Whitelam GC, Johnson E, Peng J, Carol P, Anderson ML, Cowl JS, Harberd NP. Phytochrome A null mutants of Arabidopsis display a wild-type phenotype in white light. Plant Cell. 1993;5:757–768. doi: 10.1105/tpc.5.7.757. [DOI] [PMC free article] [PubMed] [Google Scholar]
- Yamaguchi R, Nakamura M, Mochizuki N, Kay SA, Nagatani A. Light-dependent translocation of a phytochrome B-GFP fusion protein to the nucleus in transgenic Arabidopsis. J Cell Biol. 1999;145:437–445. doi: 10.1083/jcb.145.3.437. [DOI] [PMC free article] [PubMed] [Google Scholar]


