Abstract
Tumors utilize various strategies to evade immune surveillance1,2. Immunotherapies targeting tumor immune evasion such as immune checkpoint blockade have shown unprecedented efficacy on multiple cancers3,4, but are ineffective for most patients due to primary or acquired resistance5–7. Recent studies showed that some epigenetic regulators suppress anti-tumor immunity2,8–12, suggesting epigenetic therapies could boost anti-tumor immune responses and overcome resistance to current immunotherapies. Here we show that depletion of KDM5B, an H3K4 demethylase critical for melanoma maintenance and drug resistance13–15, induces robust adaptive immune responses and enhances responses to immune checkpoint blockade. Mechanistically, KDM5B recruits the H3K9 methyltransferase SETDB1 to repress endogenous retroelements such as MMVL30 in a demethylase-independent manner. De-repression of these retroelements activates cytosolic RNA and DNA sensing pathways and subsequent type I interferon response, leading to tumor rejection and induction of immune memory. Our results demonstrate that KDM5B suppresses anti-tumor immunity by epigenetic silencing of retroelements. Thus, we reveal the novel roles of KDM5B in heterochromatin regulation and immune evasion in melanoma, opening a new venue for the development of KDM5B and SETDB1 targeting therapies to enhance tumor immunogenicity and overcome immunotherapy resistance.
Inverse correlation of KDM5B with immune genes
Gene ontology analysis showed that KDM5B expression is negatively correlated with genes in immune system processes (Fig.1a). Specifically, it is inversely associated the levels of T cell markers, antigen presentation, and cytokine genes, including IFNG (IFN-γ) and TNF (TNF-α), two crucial effector cytokine genes, and T-cell chemoattractant genes CXCL9/1016 (Extended Data Fig.1a,b). Lack of T cell infiltration in pre-treatment biopsies typically correlates with resistance to immune checkpoint blockade (ICB)17. We first analyzed RNA-seq data of pre-treatment specimens from melanoma tumors sampled prior to anti-PD-1 therapy5 and found that KDM5B mRNA levels are significantly lower in tumors from patients with complete response than those from patients with progressive disease (Fig.1b, Supplementary Table 1). Furthermore, patients who responded to ICB had weak KDM5B staining and lacked detectable KDM5Bhigh melanoma cells, while the non-responders had a major subset of KDM5Bhigh melanoma cells (Extended Data Fig. 1c). These data suggest that KDM5B is inversely correlated with intra-tumoral inflammation and could be a biomarker for poor response to ICB. Thus, targeting KDM5B might induce T-cell infiltration and overcome resistance to ICB.
Fig. 1. Depletion of KDM5B induces anti-tumor immunity in an adaptive immune system dependent manner.
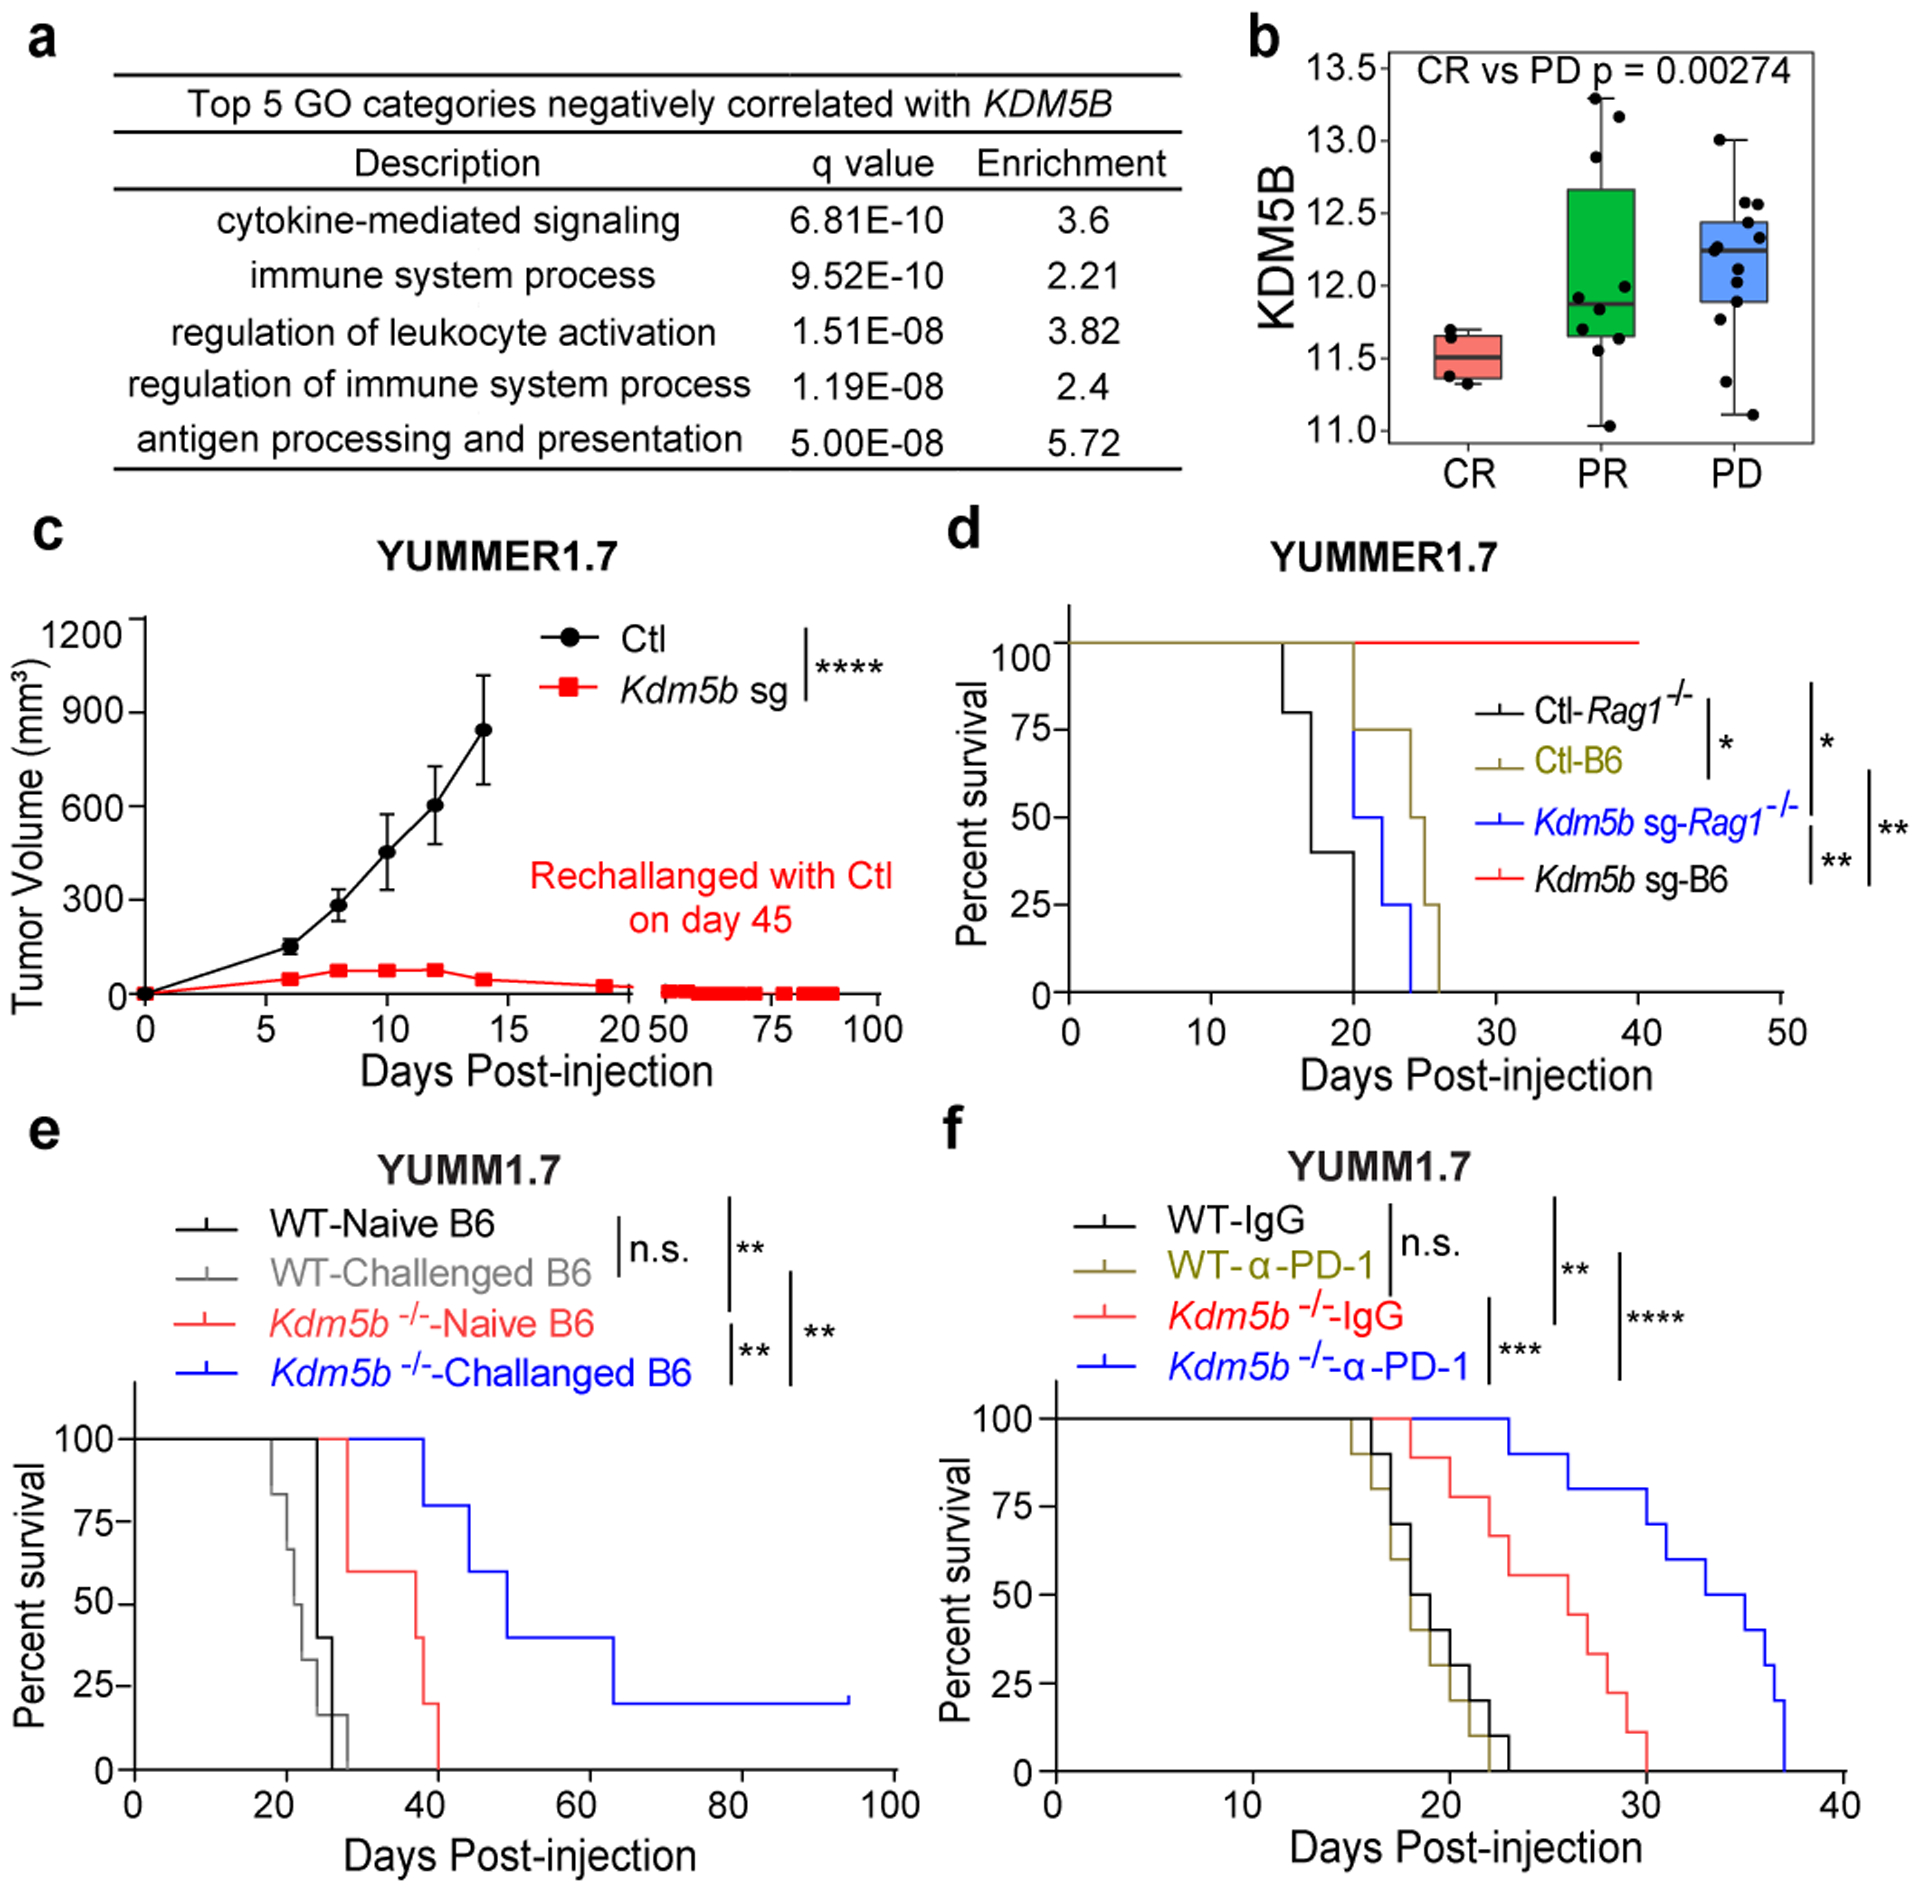
a, Gene Ontology (GO) pathways negatively correlated with KDM5B. b, Box plot showing KDM5B mRNA levels in tumors from patients with complete response (CR, n=4), partial response (PR, n=10), or progressive disease (PD, n=13). p value by unpaired two-sided Student’s t test. c, Tumor growth curves of C57BL/6 mice subcutaneously injected with 500,000 control (Ctl) (n=6) or Kdm5b−/− (Kdm5b sg) (n=6) YUMMER1.7 cells. Mice injected with Kdm5b−/− cells were re-challenged with control cells on day 45. Data are representative of two independent experiments. Data are mean ± SEM. ****p<0.0001. d, Survival curves of wild-type (WT) C57BL/6J (B6) mice injected with control (n=4) or Kdm5b sgRNA (n=4) or Rag1−/− mice injected with control (n=5) or Kdm5b sgRNA YUMMER1.7 cells (n=4). *p=0.0184 for Ctl-Rag1−/− vs Ctl-B6; *p=0.0376 for Ctl-Rag1−/− vs Kdm5b sg-Rag1−/−; **p=0.0067 for Ctl-B6 vs Kdm5b sg-B6; **p=0.0062 for Kdm5b sg-B6 vs Kdm5b sg-Rag1−/−. Data represent one experiment. e, Survival curves of C57BL/6J (B6) mice that rejected Kdm5b−/− YUMMER1.7 tumors (Challenged B6) rechallenged with WT (n=6) or Kdm5b−/− YUMM1.7 cells (n=5) compared with age matched Naïve B6 mice rechallenged with YUMM1.7 (n=5) or Kdm5b−/− YUMM1.7 cells (n=5). Data represent one experiment. n.s., not significant; **p= 0.0023 for WT-Naïve B6 vs Kdm5b−/−-Naïve B6; **p=0.0014 for WT-Challenged B6 vs Kdm5b−/−-Challenged B6; **p=0.0086 for Kdm5b−/− -Naïve B6 vs Kdm5b−/−-Challenged B6. f, Survival curves of C57BL/6 mice injected with WT YUMM1.7 cells treated with IgG control (n=10) or anti-PD-1 antibody (n=10); or Kdm5b−/− YUMM1.7 cells treated with IgG control (n=9) or anti-PD-1 antibody (n=10). Data are representative of two independent experiments. **p=0.0021 for WT-IgG vs Kdm5b−/−-IgG; ****p<0.0001 for WT-α-PD-1 vs Kdm5b−/−-α-PD-1; n.s. for WT-IgG vs WT-α-PD-1; ***p=0.0007 for Kdm5b−/−-IgG vs Kdm5b−/− -α-PD-1.
KDM5B loss induces anti-tumor immunity
We assessed the effects of Kdm5b deletion in the immunogenic YUMMER1.7 mouse melanoma model18 on tumor growth in syngeneic C57BL/6J mice (Fig. 1c, Extended Data Fig. 1d,e). Polyclonal Kdm5b−/− YUMMER1.7 cells were rejected completely, whereas control cells formed tumors as expected. Furthermore, the mice that rejected Kdm5b−/− tumors are protected against re-challenge by control YUMMER1.7 cells, suggesting the development of immune memory. KDM5B loss results in a significant increase in T cells, especially CD8+ T cells in these tumors, and increased tumor cell death (Extended Data Fig. 1f–i). Consistent tumor growth results were obtained with Kdm5b−/− YUMMER1.7 single cell-derived clones (Extended Data Fig. 1j,k). The differences of tumor growth between Kdm5b−/− and control YUMMER1.7 cells are much smaller in immunodeficient Rag1−/− mice, which have no mature B and T cells (Fig. 1d, Extended Data Fig. 1l). Similar results were observed in the less immunogenic YUMM1.7 cells (Fig. 1e, Extended Data Fig 1m,n). These results showed that KDM5B depletion induces potent anti-tumor immunity.
YUMMER1.7 cells were generated from YUMM1.7 cells by UVB radiation and have additional somatic mutations that could result in neoantigens18. We rechallenged mice that rejected Kdm5b−/− YUMMER1.7 tumors with wild-type or Kdm5b−/− YUMM1.7 cells (Fig.1e). Although these mice rejected the rechallenge by YUMMER1.7 cells (Fig. 1c), YUMM1.7 cells grew in a similar rate in these challenged hosts as in naïve hosts (Fig. 1e, Extended Data Fig. 1n). However, Kdm5b−/− YUMM1.7 cells grew much slower or were rejected in challenged hosts (Fig. 1e, Extended Data Fig. 1n). These results indicated that tumor antigens responsible for rejection are only shared between Kdm5b−/− YUMMER1.7 and Kdm5b−/− YUMM1.7 cells, and thus are due to KDM5B loss. Furthermore, depletion of CD8+ T cells dampened the protection to rechallenge by Kdm5b−/− YUMM1.7 cells (Extended Data Fig. 1o), suggesting that memory CD8+ T cells are critical for recognition of potential antigens induced by Kdm5b loss. Using an ICB resistant YUMM1.7 murine melanoma model18, we found that depletion of KDM5B not only significantly decreases the growth rate of YUMM1.7 tumors, but also renders these tumors sensitive to anti-PD-1 treatment (Fig.1f, Extended Data Fig. 1p,q).
KDM5B loss induces an interferon response
To determine how KDM5B suppresses anti-tumor immunity, we performed RNA-seq analysis of control and Kdm5b−/− YUMMER1.7 cells (Supplementary Tables 2–3). Gene Set Enrichment Analysis (GSEA) showed that pathways that activate type I interferon responses, such as RIG-I like receptor signaling and cytosolic DNA sensing pathways, are elevated in Kdm5b−/− cells (Fig. 2a, Extended Data Fig. 2a, Supplementary Tables 4–5). Consistently, KDM5B depletion led to increased protein levels of MDA5, RIG-I, MAVS, cGAS, IRF9, and phosphorylated TBK1, IRF3, and STAT1 (Extended Data Fig. 2b). Similarly, in three other mouse melanoma cell lines, Ifngr1−/− YUMMER1.7, YUMM1.7, and 144519, Kdm5b depletion led to activation of interferon stimulated genes (ISGs) (Extended Data Fig. 2c–e). Depletion of RNA sensor MDA5 or DNA sensor cGAS in Kdm5b−/− YUMMER1.7 cells, significantly diminished induction of ISGs (Fig. 2b, Extended Data Fig. 2f,g) and partially rescued their ability to form tumors in vivo (Fig. 2c, Extended Data Fig. 2h), while depletion of RNA sensor RIG-I (encoded by Ddx58 gene) did not affect induction of ISGs (Fig 2b, Extended Data Fig. 2f,g). Similar results were observed in YUMM1.7 and 1445 cells (Extended Data Fig. 2i,j). Consistently, abrogation of downstream adaptor MAVS for RNA sensing or STING (encoded by Sting1 gene) for DNA sensing in Kdm5b−/− cells, also diminished ISG induction (Extended Data Fig. 2i–l) and partially rescued their tumor forming ability in vivo (Fig. 2c, Extended Data Fig. 2h). Moreover, simultaneous depletion of both MAVS and STING or both MDA5 and cGAS further rescued in vivo tumor growth phenotype of Kdm5b−/− cells (Fig. 2c, Extended Data Fig. 2m). These results suggest that both RNA and DNA sensing pathways are critical for the activation of type I interferon pathway induced by KDM5B depletion. Type I interferon is a positive regulator for MHC I antigen-processing machinery20,21. Consistently, ablation of KDM5B increased the expression of MHC class I molecules and genes in antigen processing and presentation pathways in YUMMER1.7, YUMM1.7 and YUMM3.3 mouse melanoma cells (Extended Data Fig. 3a–c).
Fig. 2. Deletion of KDM5B activates the type I interferon response through both cytosolic RNA and DNA sensing pathways.
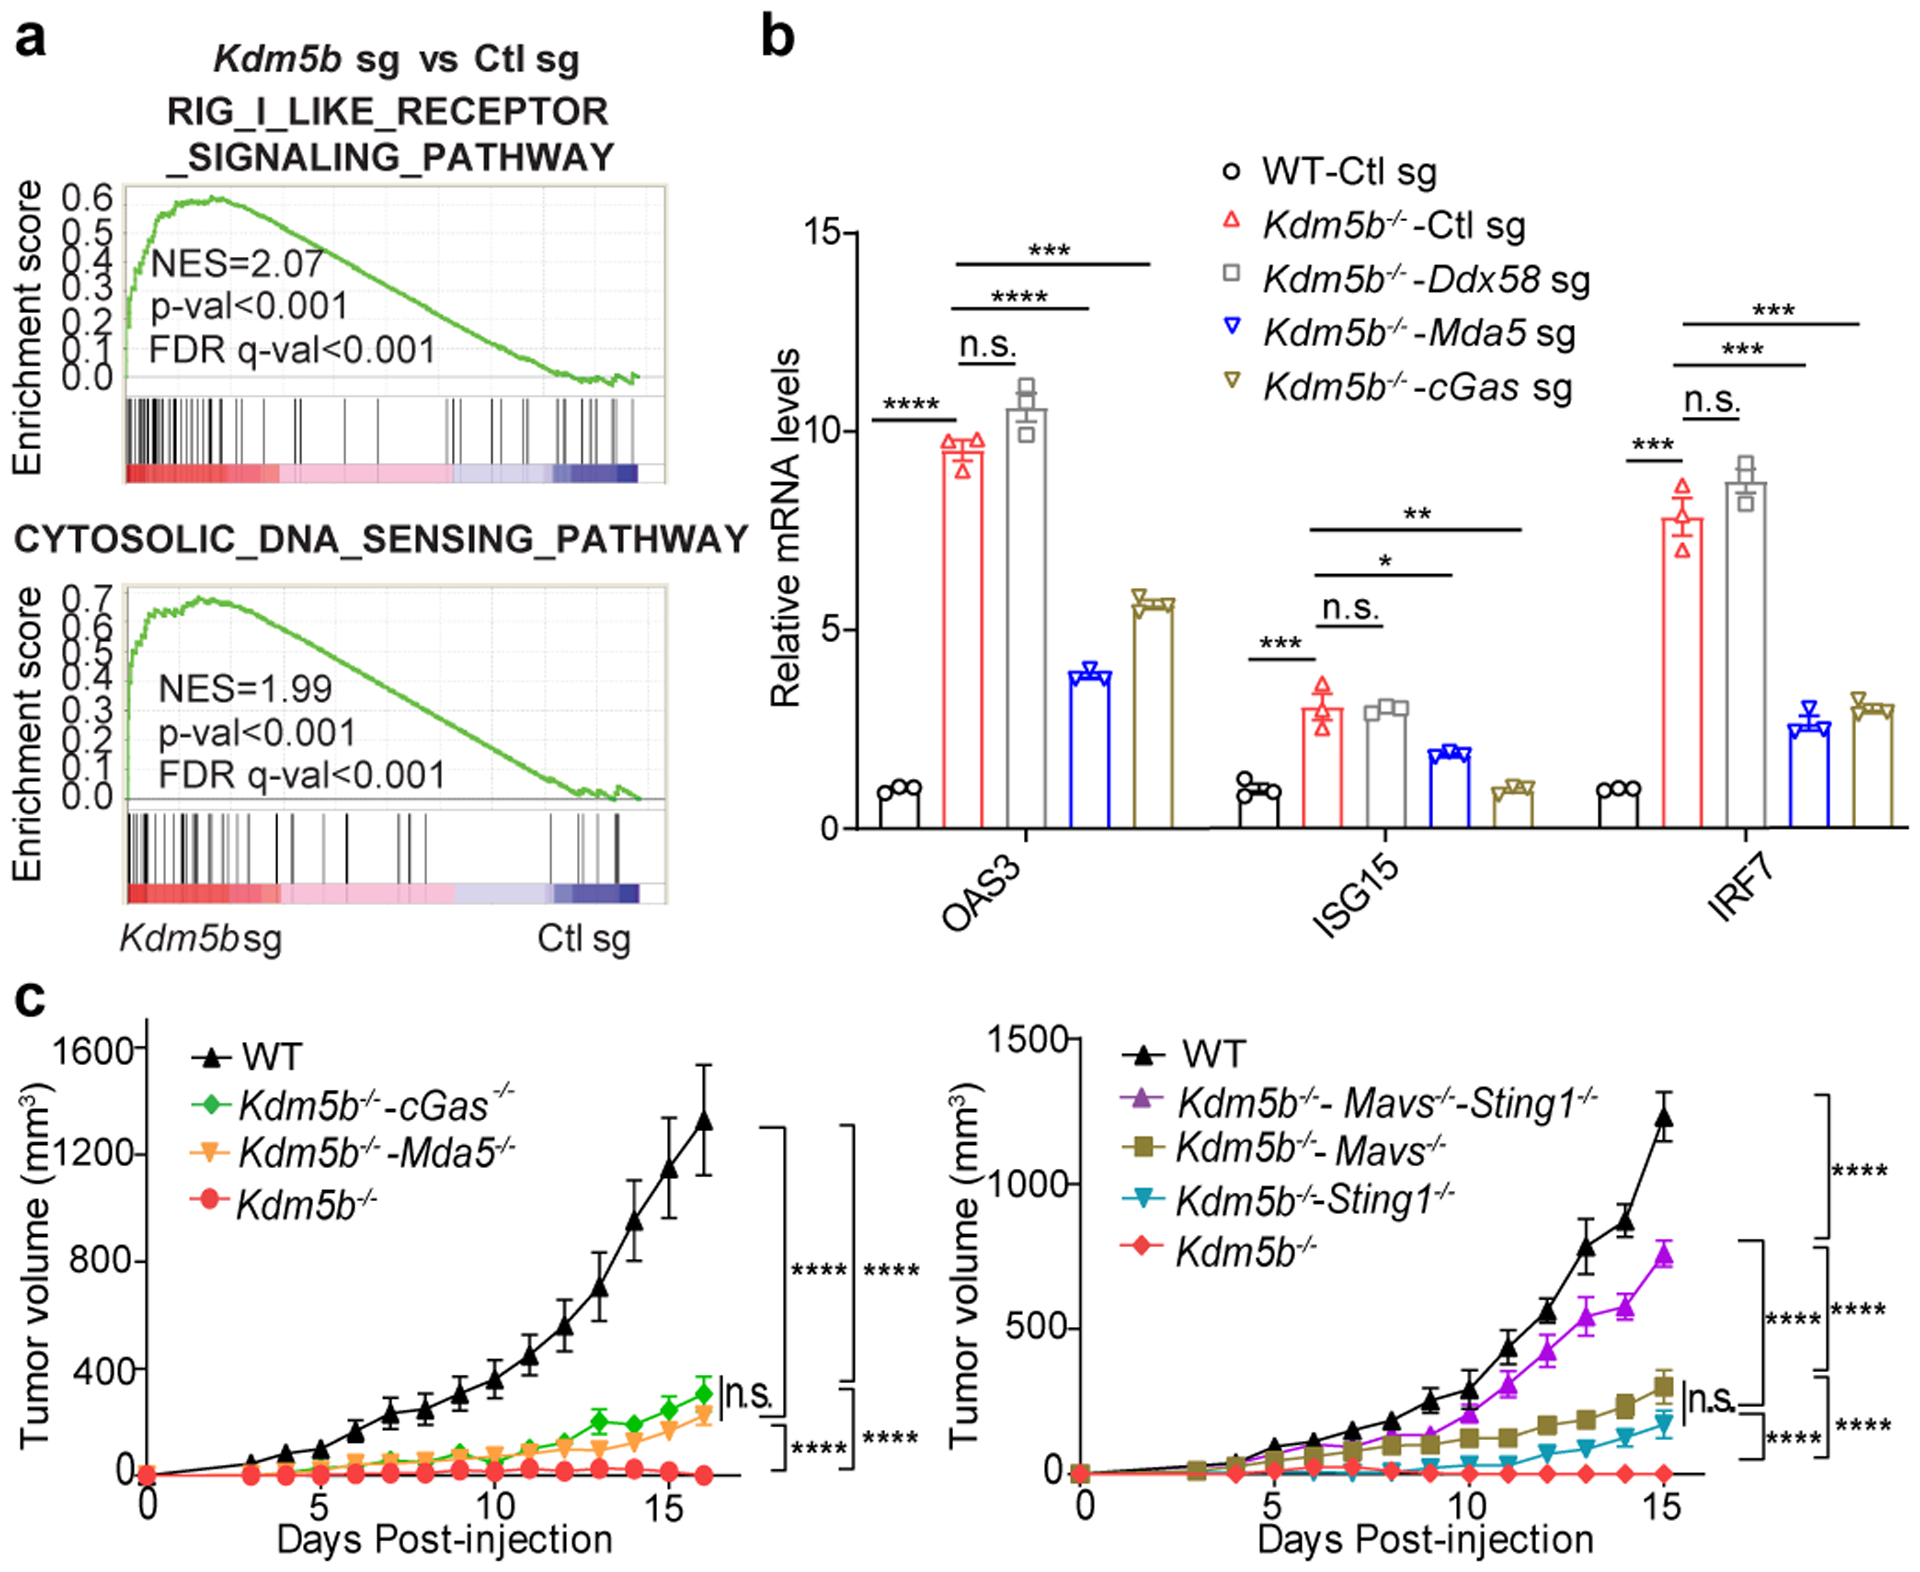
a, GSEA plots of two top pathways induced by KDM5B deletion in YUMMER1.7 cells. FDR, false discovery rate. b, RT-qPCR analyses of selected ISGs in the indicated YUMMER1.7 cells. Data are mean ± SD. c, Tumor growth curves of C57BL/6 mice injected with YUMMER1.7 cells of the indicated genotypes. Left: wild-type (WT, n=4), Kdm5b−/−-Mda5−/− (n=6), Kdm5b−/−-cGas−/− (n=5), Kdm5b−/− (n=5); Right: WT (n=5), Kdm5b−/−-Sting1−/−-Mavs−/− (n=5), Kdm5b−/−-Mavs−/− (n=4), Kdm5b−/−-Sting1−/− (n=4), Kdm5b−/− (n=5). Data are representative of two independent experiments. Data are mean ± SEM. n.s., not significant; *p<0.05; **p<0.01; ***p<0.001; ****p<0.0001.
KDM5B represses retroelement expression
Stranded specific RNA-seq analysis showed increased bi-directional transcripts from retroelements, including Long Terminal Repeat (LTR) containing Endogenous Retroviruses (ERVs) and non-LTR elements, such as Long Interspersed Nuclear Elements (LINEs) in YUMMER1.7 cells upon KDM5B loss (Fig. 3a,b, Supplementary Tables 6–7). Kdm5b inactivation also led to induction of retroelements in YUMM1.7 and 1445 mouse melanoma cells (Extended Data Fig. 3d,e). These induced retroelements led to increased dsRNAs in YUMMER1.7 and 1445 cells (Extended Data Fig. 4a,b) and YUMMER1.7 tumors (Extended Data Fig. 4c). Furthermore, we detected higher levels of dsRNAs in responders with low KDM5B expression than those in non-responders with high KDM5B levels (Extended Data Fig. 4d). It has been suggested that bi-directional transcripts of endogenous retroelements or inverted repeat SINE elements form immunogenic dsRNAs to activate type I interferon pathway22,23,24. More inverted repeats decreased in expression in YUMMER1.7 cells upon KDM5B loss (Extended Data Fig. 4e and Supplementary Table 8), suggesting that inverted repeats may not be the dominant factors for activation of the type I interferon response.
Fig. 3. Deletion of KDM5B de-represses endogenous retroelements, which can be reverse transcribed into cDNAs.
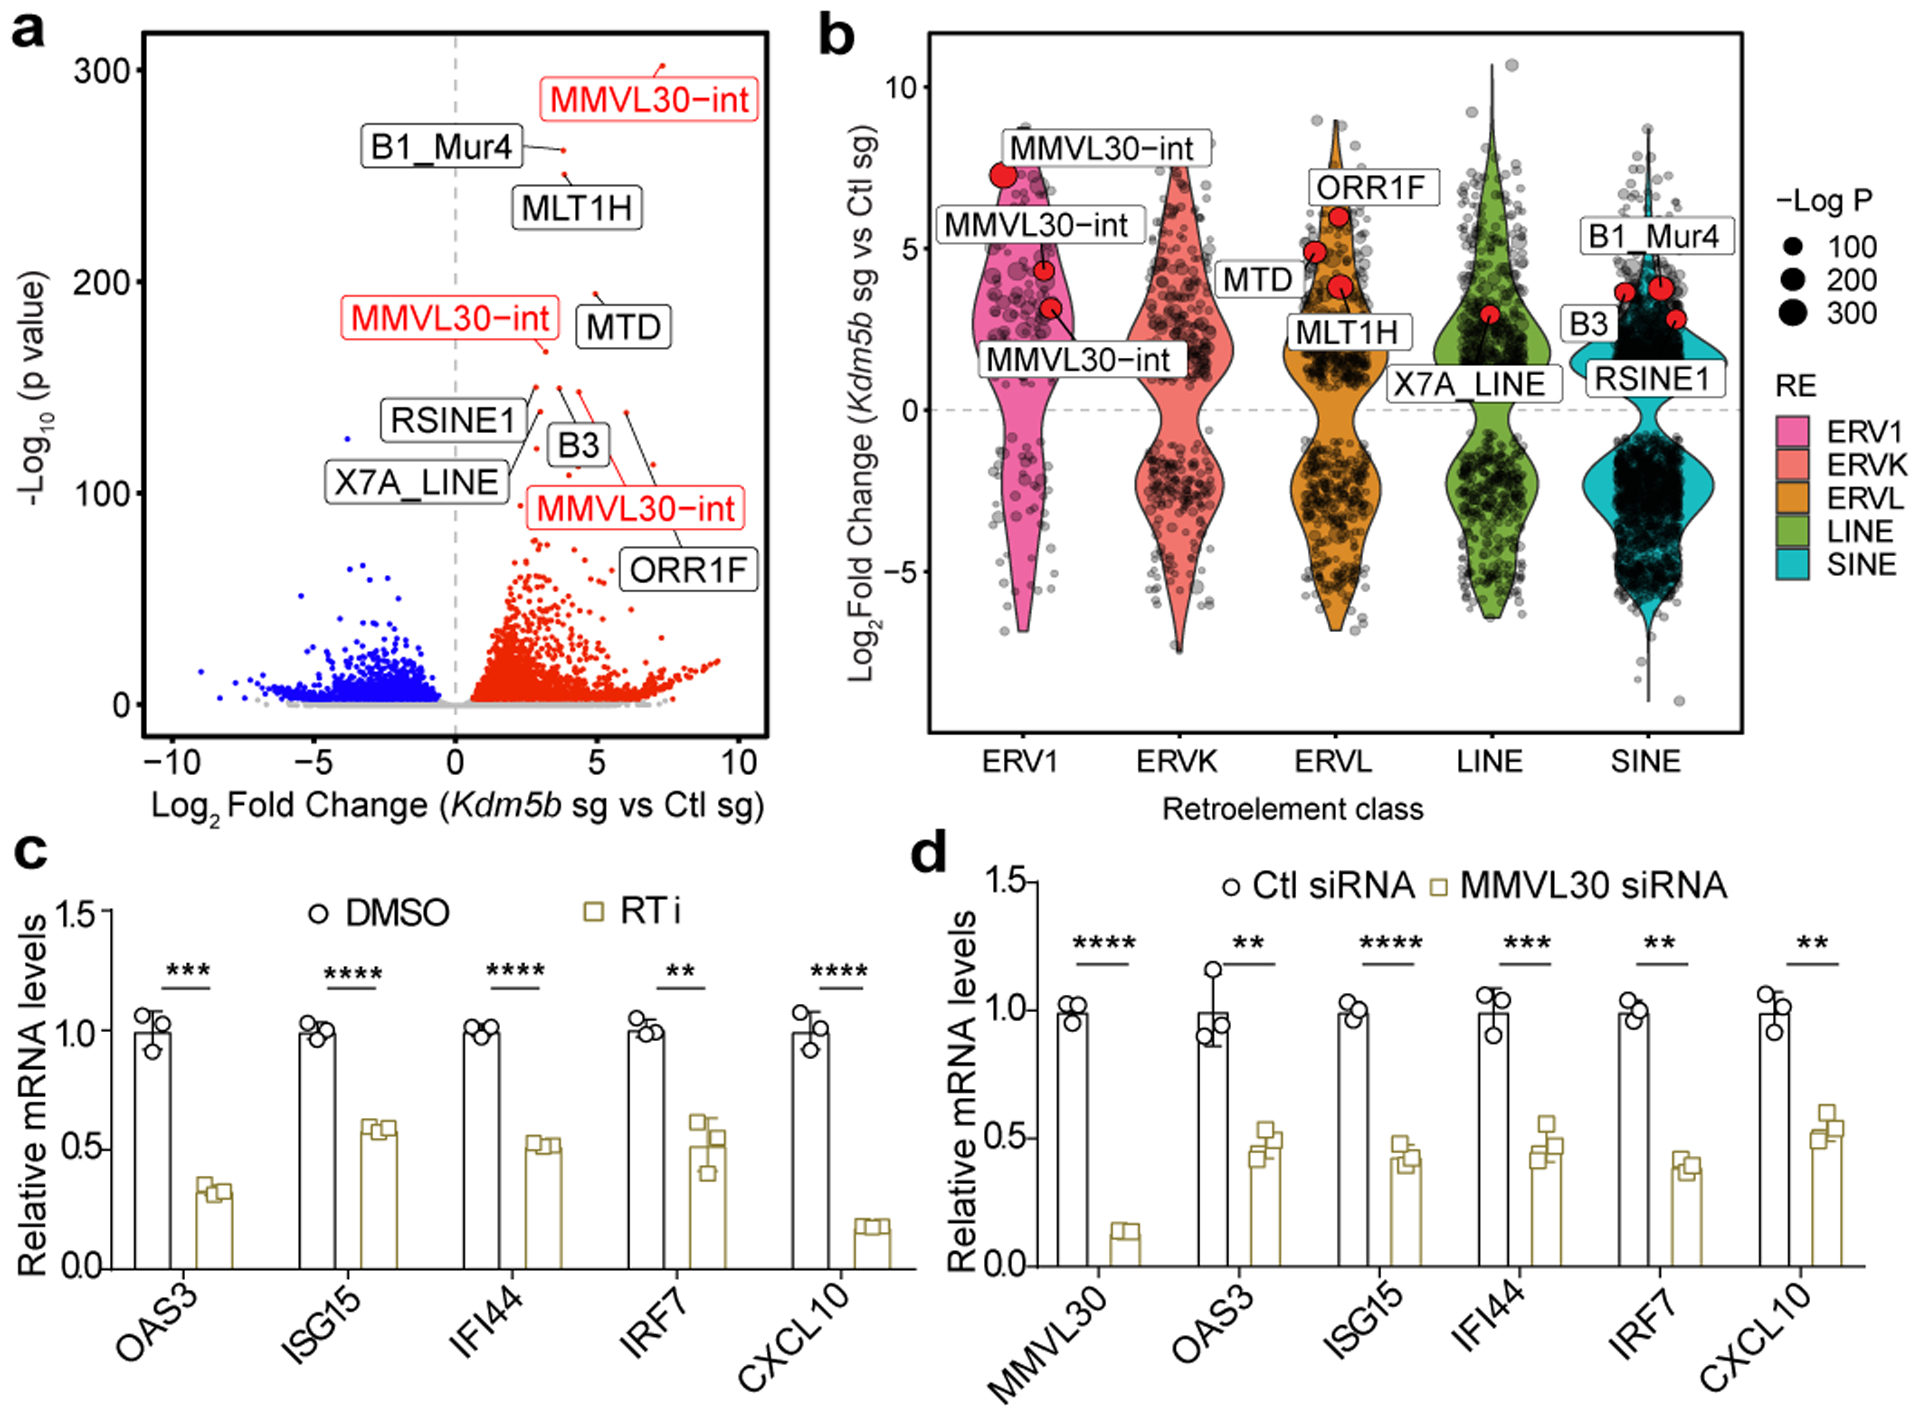
a, Volcano plot showing retroelement loci with increased expression (red) and decreased expression (blue) (FDR< 0.05) in Kdm5b−/− (Kdm5b sg) vs control YUMMER1.7, combining both forward and reverse strands. Top 10 significantly differential loci are labeled, with MMVL30-int loci highlighted in red. b, Violin plots showing differential expressed retroelement classes comparing Kdm5b−/− (Kdm5b sg) to control YUMMER1.7 cells (FDR<0.05). c,d, RT-qPCR analyses of Kdm5b−/− YUMMER1.7 cells treated with 20 μM of reverse transcriptase inhibitors (RTi) for 48h (c) or Kdm5b−/− cells treated with control or MMVL30 targeting siRNA for 3 days (d). Data are mean ± SD. n.s., not significant; **p<0.01; ***p<0.001; ****p<0.0001.
As we showed that the DNA sensing pathway contribute to the activation of type I IFN signaling, we reasoned that cytosolic DNA may be generated via reverse-transcription of retroelements. In fact, treatment by reverse transcriptase inhibitors (RTi) zidovudine and nevirapine suppressed activation of type I IFN pathway (Fig. 3c, Extended Data Fig. 4f). Furthermore, we observed decreased cytosolic retroelement cDNAs in RTi treated Kdm5b−/− cells (Extended Data Fig. 4g), but no change in copy numbers of mitochondrial DNA (Extended Data Fig. 4h). Knockdown of MMVL30, a top KDM5B loss-induced ERV, decreased ISG induction (Fig. 3d and Extended Data Fig. 4i), indicating that MMVL30 contributes significantly to ISG induction.
ChIP-qPCR analyses on representative retroelement loci in YUMMER1.7 cells showed that these loci are bound by KDM5B (Extended Data Fig. 5a). However, H3K4me3 levels on these loci were not altered upon KDM5B depletion (Extended Data Fig. 5b). Consistently, re-introduction of either wild-type KDM5B or catalytically inactive KDM5B into Kdm5b−/− cells reversed the de-repression of retroelements and ISGs (Fig. 4a), and rescued the tumor growth defects of these cells in vivo to the same extent (Fig. 4b). In addition, treatment with pan-KDM5 inhibitors did not significantly induce retroelements or ISGs (Extended Data Fig. 5c–d). Together, these data suggest that regulation of retroelements by KDM5B is independent of its demethylase activity.
Fig. 4. KDM5B suppresses the expression of retroelements by recruiting H3K9 methyltransferase SETDB1.
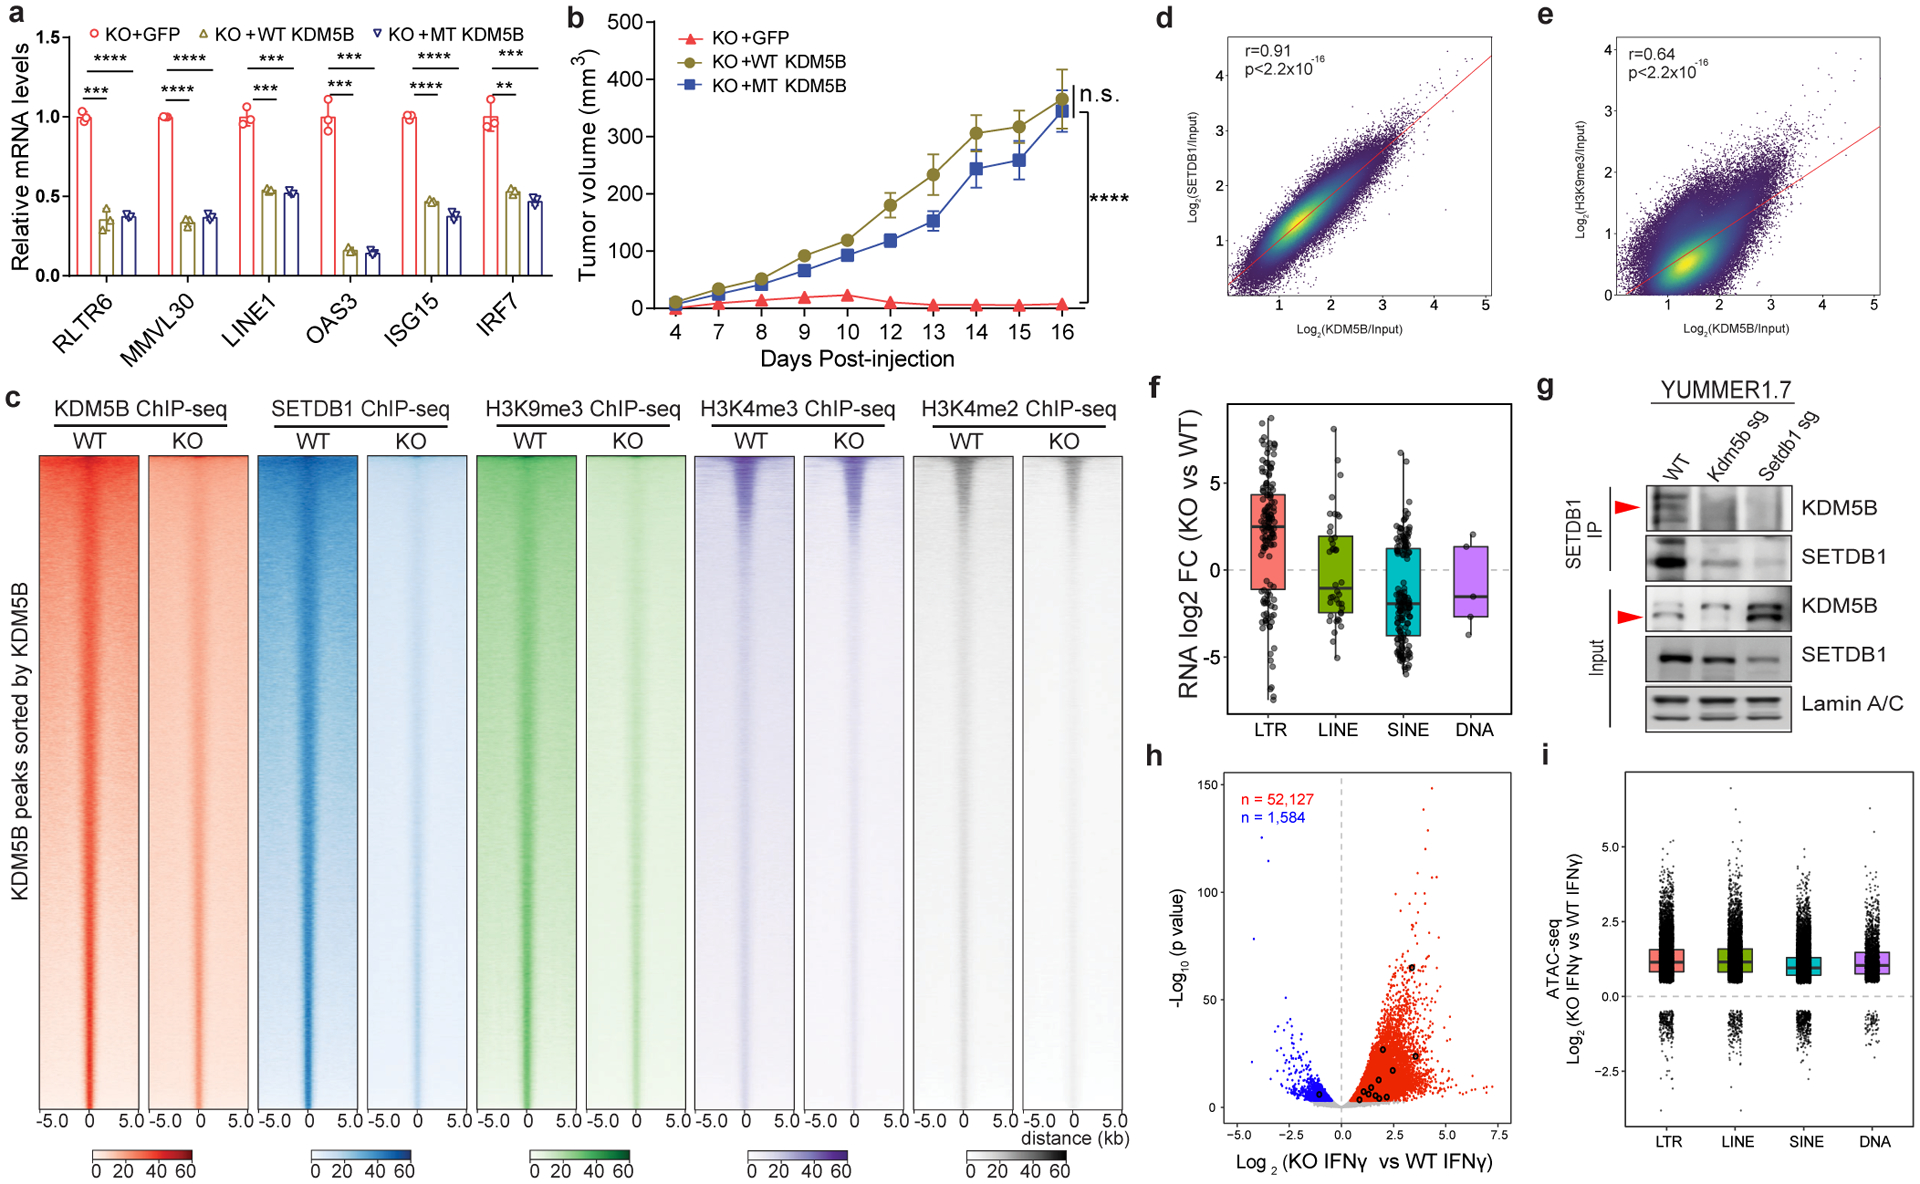
a, RT–qPCR analyses of Kdm5b−/− (KO) YUMMER1.7 cells, with GFP control, or reconstituted expression of wild-type (WT)-KDM5B or catalytically inactive mutant (MT) KDM5B. Data are mean ± SEM. **p<0.01; ***p<0.001, ****p<0.0001. b, Tumor growth curves of C57BL/6 mice injected with KO+GFP (n=4), KO+WT KDM5B (n=5), KO+MT-KDM5B (n=6). Data are representative of two independent experiments. Data are mean± SEM. n.s. not significant; ****p<0.0001. c, Heatmap of KDM5B, SETDB1, H3K9me3, H3K4me3 and H3K4me2 ChIP-seq signal within KDM5B peaks in WT and Kdm5b−/− YUMMER1.7 cells. Peaks were sorted according to KDM5B signal in WT cells. d,e, Correlation between ChIP-seq signals of KDM5B and SETDB1 (d) or H3K9me3 (e) in YUMMER1.7 cells. Two-sided Pearson’s correlation test. f, Box plot showing log2 Fold Change (FC) of RNA-seq signals in Kdm5b−/− vs WT for four different categories of transposable elements located within regions with KDM5B, SETDB1 and H3K9me3 binding. g, Western blot analyses of SETDB1 immunoprecipitates with nuclear extracts from WT, Kdm5b sg and Setdb1 sg YUMMER1.7 cells. For gel source data, see Supplementary Fig. 1. h, Volcano plot showing ATAC-seq signals from WT and Kdm5b−/− YUMMER1.7 cells, treated with 200 ng/ml IFNγ for 36h; Shown are increased (red) and decreased (blue) peaks in Kdm5b−/− cells (FDR < 0.05). Significantly changed peaks overlapping MMVL30-int loci are marked in black. i, Box plot showing log2 Fold Change of ATAC-seq signals in (Kdm5b−/− treated with IFNγ vs WT treated with IFNγ) for four different categories of transposable elements.
KDM5B recruits SETDB1 to repress its targets
While H3K27me3 methyltransferase inhibitors EPZ6438 and GSK343 had minimal effects on MMVL30 and ISGs, H3K9me3 methyltransferase inhibitor chaetocin induced their expression in a dose-dependent manner (Extended Data Fig. 5e,f). Consistently, while KDM5B loss did not change H3K27me3 levels at the retroelement loci, it decreased H3K9me3 levels at the retroelement loci (Extended Data Fig. 5g,h). While G9a and Suv39h1 deletion had no effect on the expression of retroelements and ISGs, Setdb1 loss led to significant induction of MMVL30 (Extended Data Fig. 5i–l). Furthermore, SETDB1 binding on those retroelements decreased in Kdm5b−/− cells and was partially restored when either wild-type KDM5B or catalytically inactive KDM5B was re-introduced (Extended Data Fig. 5m).
ChIP-seq analyses of YUMMER1.7 cells (Supplementary Tables 9–13) revealed enrichment of SETDB1 and H3K9me3 within KDM5B binding peaks in wild-type cells compared to Kdm5b−/− cells, and minimal changes of the H3K4me3 and H3K4me2 levels after Kdm5b loss (Fig. 4c). KDM5B binding is strongly enriched at intergenic (48%) and intron regions (39%), (Extended Data Fig. 6a), and at the retroelements induced by Kdm5b loss (Extended Data Fig. 6b). Similar results were observed in 1445 cells (Extended Data Fig. 6c–d and Supplementary Table 14). We found a significant positive correlation between KDM5B and SETDB1 peaks (Fig. 4d), as well as between KDM5B and H3K9me3 peaks (Fig. 4e). Consistently, 61.2% KDM5B and SETDB1 binding peaks overlapped (Extended Data Fig. 6e). Among KDM5B-SETDB1 overlapping regions, we found that LTR containing ERVs tend to have increased expression upon KDM5B loss (Extended Data Fig. 6f). Similar results were found among the shared regions among KDM5B, SETDB1 and H3K9me3 (Fig. 4f and Extended Data Fig. 6g). Consistently, co-immunoprecipitation (IP) showed KDM5B interacts with SETDB1 in YUMMER1.7, 1445 and YUMM1.7 cells, as well as MC38 mouse colorectal cancer cells (Fig. 4g, Extended Data Fig. 6h,i). Loss of KDM5B leads to decreased binding of SETDB1 and decreased H3K9me3 repressive mark on the MMVL30 loci, but did not change the active marks H3K4me3 or H3K4me2 (Extended Data Fig. 7a–c).
ATAC-seq analysis showed that Kdm5b loss increases chromatin accessibility globally (Extended data Fig. 7d) and specifically on transposable elements (TEs) (Extended Data Fig. 7e). KDM5B binding domains with ATAC peaks are enriched for TEs, with even higher percentage of TEs in regions with increased chromatin accessibility upon KDM5B loss than those with unchanged ATAC peaks (Extended Data Fig. 7f). Chromatin opening was even more strongly induced in Kdm5b−/− YUMMER1.7 cells treated with IFNγ (Fig. 4h–i, and Extended Data Fig. 7g). KDM5B peaks are enriched for binding sites for BCL11A, GATA5, HIC1, ZFP691, and ZSCAN4, all zinc-finger proteins (Extended Data Fig. 7h). We found enrichment of CTCF and NFAT binding sites in chromatin regions that gained accessibility upon KDM5B loss (Extended Data Fig. 7i–j). Within KDM5B domains, the retroelements with increased accessibility upon KDM5B loss showed enriched binding sites for FOXJ3 and ZNF416 (Extended Data Fig. 7k,l).
We noticed that there is a decreased nuclear level of SETDB1 in Kdm5b−/− cells (Fig. 4g). Proteasome inhibitor MG132 significantly increased nuclear SETDB1 protein levels in Kdm5b−/− YUMMER1.7 cells (Extended Data Fig. 8a), suggesting that KDM5B regulates SETDB1 stability in a proteasome-dependent manner. Neither wild-type nor mutant SETDB1 repressed induction of retroelements or ISGs in Kdm5b−/− YUMMER1.7 cells (Extended Data Fig. 8b,c). Consistently, overexpression of SETDB1 in Kdm5b−/− cells is unable to increase H3K9me3 levels on those loci, while either wild-type or catalytically inactive KDM5B increases H3K9me3 levels on those loci (Extended Data Fig. 8d). Furthermore, SETDB1 was unable to fully rescue the ability of Kdm5b−/− YUMMER1.7 cells to form tumors in vivo (Extended Data Fig. 8e,f).
Growing evidence suggested that retroelement derived peptides could be potential immunogenic neoantigens recognized by specific T cells25,26. Expression of Murine Leukemia Virus (MuLV) envelope protein was not significantly changed after KDM5B deletion in YUMMER1.7 cells (Extended Data Fig. 8g). Consistently, KDM5B loss did not affect p15E+CD8+ T cells in YUMMER1.7 tumors (Extended Data Fig. 8h). To identify potential antigens derived from retroelements, we performed NetMHC epitope prediction analysis using the open reading frames of retroelements induced by KDM5B loss in YUMMER1.7 cells and identified 396 strong-binding peptides out of a total of putative 174,492 predicted peptides (Supplementary Table 15). We assessed the ability of four peptides from the top 10 list to bind to H2-Kb and found that all these peptides are capable of assembling efficiently with H2-Kb (Extended Data Fig 8i).
KDM5B represses ERVs in human melanoma
Consistent with our results in mouse melanoma cells, depletion of KDM5B in YUDOSO and YURIF human melanoma cell lines also induced the expression of ERVs and ISGs (Extended Data Fig. 9a,b). However, RNA sensing pathway genes DDX58 (encodes RIG-I) and MAVS are critical for activation of the type I IFN pathway, but DNA sensing pathway genes cGAS and STING1 and RNA sensing pathway gene MDA5 are not (Extended Data Fig. 9c).
We found that the ERVs negatively correlated with KDM5B expression such as ERVmap_2637 are expressed significantly higher in patients with complete responses to anti-PD-1 treatment than in patients with progressive disease (Extended Data Fig. 10 a–c). In contrast to KDM5B, KDM5A, KDM5C or KDM5D is not correlated with anti-PD-1 response (compare Fig. 1b with Extended Data Fig. 10 d–f). We also analyzed multiple known immune-modulatory epigenetic regulators (Extended Data Fig. 10 g–k). While there is no significant correlation for DNMT1, SETDB1 and EZH2; KDM1A and DNMT3B are also inversely correlated with anti-PD-1 responses, consistent with the previous reports8–10.
Discussion
Here we show that KDM5B loss in melanoma cells de-represses expression of retroelements, activates type I IFN signaling pathway, and induces anti-tumor responses (Extended Data Fig. 10l). Depletion of critical components of DNA and RNA sensing pathways rescued the in vivo tumor growth defect of Kdm5b−/− cells (Fig. 2c and Extended Data Fig. 2m), suggesting that KDM5B promotes tumor growth mainly by suppressing these two pathways. Our rechallenge experiments indicate that antigens induced by Kdm5b loss play critical roles in the immune memory response (Fig. 1e, Extended Data Fig. 1n). Future experiments are needed to identify these antigens, which could be encoded by retroelements induced by Kdm5b loss.
Epigenetic regulators often form multiple-protein complexes and have functions independent of their catalytic activity. Rescue experiments with catalytically inactive mutant or experiments using small molecule demethylase inhibitors showed that the KDM5 demethylases have non-catalytic activity27,28. Here we reveal that KDM5B represses anti-tumor immunity by recruiting SETDB1 in a demethylase-independent manner. During the revision of our manuscript, it was reported that SETDB1 epigenetically silences TEs and immune genes to suppress anti-tumor immune responses29. The effect of SETDB1 depletion on tumor growth was limited to the ICB setting in the models tested29, while KDM5B loss induced tumor suppression in the absence of ICB. These differences could be due to the regulation of different TEs in different models. Taken together, our results suggest strategies that destabilize KDM5B or block KDM5B-SETDB1 interaction are effective immune modulatory anti-cancer treatment and can improve efficacy and overcome resistance to immune checkpoint blockade.
Methods
Cell lines and plasmids
Stable KDM5B knockout (KO) and further DNA or RNA sensor (RIG-I, MDA5, cGAS, MAVS and STING) KO in mouse melanoma lines YUMMER1.7, YUMM1.7, 1445 or human melanoma cell lines YURIF and YUDOSO (obtained from Dr. Ruth Halaban’s lab at Yale University) were generated using lentiviruses produced in 293T cells with lentiCRISPR-v2 vectors containing specific sgRNA (sg) and selected with puromycin or blasticidin as previously described15. For validation, KDM5B KO with or without DNA or RNA sensors double KO or triple KO non-virus single clones of YUMMER1.7 were generated with pSpCas9 (BB)-2A-GFP (pX458). Stable knockdown of KDM5B in mouse or human melanoma cells was achieved using lentiviral shRNA hairpins against KDM5B15. Doxycyline-inducible knockdown of MMVL30 in Kdm5b KO cell was generated with pINDUCER10 shRNA constructs. pLX304 3xHA-KDM5B or Flag-SETDB1 lentiviral vectors were constructed by gateway cloning. Stable cell lines were generated using pLX304 vectors and selected with blasticidin. MC38 cell line was obtained from Kerafast. Cell lines obtained were not authenticated and were tested negative for mycoplasma. SgRNA, shRNA and siRNA information are listed in Supplementary Tables 16–17.
Animal experiments
Male wild-type and Rag1−/− C57BL/6J mice were purchased from Jackson laboratories. All mouse procedures were approved by the Institutional Animal Care and Use Committee of Yale University and conducted in accordance with the guidelines. Animals are housed in Yale Animal Resources Facilities with 12h:12h light:dark cycle, at ambient temperature of 68–79°F and humidity of 30–70%. Five to eight-week old mice were age-matched for tumor inoculation. Group sizes were selected based upon prior knowledge. Mice were age, gender and genetic background-matched and randomized appropriately, but blinding was not done. For YUMMER1.7 cell, 0.5×10⁶ cells in 100μl PBS were injected. For YUMM1.7 cell, 100,000 cells were injected. For CD8+ T cell depletion experiments, 200 μg of anti-mouse CD8α (2.43, Bio X Cell) or Rat IgG (IRTSDIGGGFLY100MG, Innovative Research) were intraperitoneally injected 2 days before tumor injection, and this treatment continued twice a week until tumor size reached the end point (1,000 mm3). For immunotherapy treatment, anti-PD-1 antibody (RMP1–14) were purchased from Bio X cell. Mice were treated with 100 μg anti-PD-1 or Rat IgG twice per week for 3 weeks since day 7 after tumor injection for YUMM1.7. Tumor volumes were calculated using the equation: 0.5233*l*w*h. The humane endpoints were determined by animal discomfort level and tumor sizes.
Immunohistochemistry and immunofluorescence analysis
Immunohistochemical sections and staining were done by Yale Mouse Research Pathology and Department of Pathology Research Histology. Anti-cleaved caspase 3 (R&D Systems #MAB835, 1:75) and anti-CD8 antibody (Invitrogen #14–0808-82, 1:100) were used. Images of representative fields were taken.
To stain cells in culture, cells were seeded on Lab-Tek chamber slides (Nunc, 178599) at 10,000 cells/cm2 and cultured for 2 days in DMEM/F12 medium (ThermoFisher, 11320033) supplemented with 10% (v/v) fetal bovine serum (Sigma-Aldrich, F7524). To perform immunostaining, cells were washed with PBS, fixed in 4% paraformaldehyde (PFA; Electron Microscopy Sciences, 15714S) for 20 minutes at room temperature (RT), and then blocked in 10% (v/v) normal goat serum (NGS; ThermoFisher, 31872) in PBST buffer (PBS with 0.3% Triton X-100 (Sigma-Aldrich, X-100)) for 30 minutes at RT. Subsequently, cells were incubated with the primary antibody against J2 (Jena Bioscience, RNT-SCI-10010500, 1:200) in 1% (v/v) NGS in PBST at 4°C overnight. Cells were washed again with PBS, incubated with secondary antibody (Alexa 555 goat anti-mouse IgG; ThermoFisher, A21426; 1:1,000 in 1% NGS in PBST) for one hour in dark at RT and washed with PBS again. Nuclei were counterstained with DAPI (ThermoFisher, D1306). Immunostained samples were obtained using a confocal fluorescence microscope (Leica TCS SP8) with objective magnification of 63x.
To stain tumor tissues from mice, tissue samples were first fixed in 10% Neural Buffered Formalin overnight and then subjected to sectioning processed by Yale Pathology Tissue Services based on standard protocols. To immunostain the human tumor tissue sections, slides were progressively dewaxed in xylene, rehydrated and boiled for 20 minutes in citrate buffer (10 mM, pH 6.0) for antigen retrieval. Subsequently, slides were blocked in PBST with 10% NGS for 30 minutes at RT, and incubated with primary antibody against J2 (Kerafast, ES2001, 1:25) in PBST with 1% NGS at 4 °C overnight in a humidified chamber. On the next day, sections were incubated with secondary antibody (Alexa 555 goat anti-mouse IgG; ThermoFisher, A21426; 1:1,000 in 1% NGS in PBST) for one hour at RT. Cell nuclei were counterstained with DAPI. Slides were eventually covered with coverslips mounted with ProLong Gold antifade medium (Invitrogen/Life Technologies, P36931). Fluorescent images were obtained using a fluorescence microscope (Nikon Eclipse 80i). To stain melanoma cells and CD3+ T cells by immunofluorescence staining, anti-Melanin A antibody (Santa Cruz, A103, sc-20032, 1:50) and anti-CD3 antibody (Abcam, ab5690,1:200) were used, following previous methods30.
Western blot analysis
Whole cell lysates were prepared with high salt lysis buffer (50 mM Tris-HCl pH 7.9, 0.1 mM EDTA pH 8.0, 320 mM NaCl, 0.5% NP40, 10% Glycerol, 1x protease inhibitor cocktail (Roche, 11873580001) and 1x phosphatase inhibitor PhosSTOP (Sigma-Aldrich, 4906845001). Histones were separated by centrifugation, resuspended in SDS loading buffer, and sonicated. Protein concentration of whole cell lysates was measured by Bradford assay (Bio-Rad, #5000006) with known BSA standards. Samples in SDS loading buffer were heated for 10 min at 95°C and loaded onto 6, 7 or 10% (whole cell lysates) or 15% (histones) SDS-PAGE gels. Membranes were blocked in 5% non-fat milk or BSA in Tris-buffered saline (50 mM Tris-HCl, 138 mM NaCl, 2.7 mM KCl, pH 7.4) with 0.05% Tween (TBS-T) and incubated with primary antibodies in the same buffer or 5% BSA in TBS-T overnight at 4°C. Membranes were incubated with secondary anti-rabbit or anti-mouse antibodies for 1 hour at room temperature. Blots were visualized by KwikQuant Imager. Primary antibodies used included anti-KDM5B (Sigma-Aldrich, HPA027179, 1:1,000 or Abcam, ab50958, 1:1,000), anti-tubulin (Sigma-Aldrich, T5168, 1:5,000), anti-histone H3 (Abcam, ab1791,1:1,000; CST, #9715, 1:1,000), anti-H3K4me3 (CST, #9751, 1:1,000), anti-H3K9me3 (CST, #13969, 1:1000), anti-SETDB1 (proteintech, 11231–1-AP, 1:1,000), anti-H3K27me3 (CST, #9733, 1:1,000), anti-G9a (CST, #68851, 1:1,000), anti-SUV39H1 (CST, #8729; 1:1,000), anti-Lamin A/C (CST, #4777, 1:1,000), anti-vinculin (Sigma-Aldrich, V9131, 1:10,000), anti-GAPDH (CST, #2118, 1:1,000), anti-MDA5 (CST, #5321, 1:1,000), anti-RIG-I (CST, #5321, 1:1,000), anti-MAVS (CST, #4983, 1:1,000), anti-cGAS (CST, #31659, 1:1,000), anti-STING (CST, #13647, 1:1,000), anti-p-TBK1 (CST, #5483, 1:1,000), anti-TBK1 (CST, #3504, 1:1,000), anti-p-IRF3 (CST, #4947, 1:1,000), anti-IRF3 (CST, #4302, 1:1,000), anti-IRF9 (CST, #28845, 1:1,000), anti-p-STAT1 (CST, #9167, 1:1,000), anti-STAT1 (CST, #9172, 1:1,000), anti-IRF7 (Thermo Fisher Scientific, PA5–20280, 1:1,000), anti-p-IRF7 (CST, #24129, 1:1,000), and anti-TLR3 (CST, #6961, 1:1,000). Raw gel images for all the figures are included in Supplementary Fig. 1.
Tissue microarray production, staining, and tissue cytometry analysis of the patient cohort
We used 65 melanoma tissue samples from patients treated at our institution with PD-1 inhibitors with or without anti-CTLA-4 between 2009 and 2015. Patient tumor characteristics and clinical information for the sixty-five patients have been previously described31. All patient tissue samples were collected with informed consent for research use with the approval from Yale Human Investigations Committee under protocol # 0609001869. The specimens were obtained from formalin-fixed, paraffin embedded (FFPE) patient melanoma tissues; a pathologist examined FFPE tissue sections from each case and selected representative regions of invasive tumor for coring; three punches from each specimen were obtained and embedded into a master tissue microarray (TMA) block using methods previously described31,32. FFPE cell line pellets were used for antibody staining controls. TMA slides were processed as previously described31,32. Antibodies included anti-KDM5B antibody (Sigma-Aldrich, HPA027179, 1:300), primary antibody against J2 (Kerafast, ES2001, 1:25), anti-S100 (BioGenex, clone 15E2E2, MU058-UC, 1:100) and anti-HMB45 (BioGenex, MU001A-UC, 1:100). Briefly, TMA slides were deparaffinized and hydrated followed by antigen retrieval. Slides were boiled for 20 minutes in a pressure cooker containing 6.5mM sodium citrate (pH 6.0). Endogenous peroxidase activity was blocked using hydrogen peroxide solution. Unspecific staining was blocked in 0.3% bovine serum albumin solution before slides were concurrently stained with a cocktail of mouse anti-S100 and mouse anti-HMB45 to detect tumor cells and anti-KDM5B antibody. For visualization of S100 and HMB45 staining we used the goat anti-mouse IgG conjugated to Alexa 546 (ThermoFisher Scientific, A-11030) in anti-rabbit amplification reagent (Envision; Dako, K4003). KDM5B staining was visualized with Cyanine-5-tyramide (Perkin Elmer, SAT705A001EA). Nuclei were visualized by incubating the slides with 4,6-diamidine-2-phenylindole (DAPI). Coverslips were mounted with ProLong Gold antifade medium (Invitrogen/Life Technologies, P36931).
The tissue microarray was imaged and analyzed by tissue cytometry according to previously published method33. Briefly, images were acquired on the TissueFAXS Quantitative Imaging System (TissueGnostics, Vienna, Austria). The entire slide (75 × 25 mm2) was scanned at low magnification using a 5× objective. The low magnification scan was used to identify the location of the tissue on the slide. A region gate was drawn around each TMA for acquisition at 20× high magnification33. The resulting images were exported as full resolution TIFF files in greyscale for each dye channel. Image processing and analysis was performed using StrataQuest software version 6.0.1.145 (TissueGnostics, Vienna, Austria). Image processing included isolation of each TMA spot and creation of pseudocolored multiplexed images from the greyscale images for each TMA spot33. Algorithms were created to isolate each cell in the multiplexed image and identify the positive cells. Global standard measurements were computed for mean grey level intensity (MGLI). Histograms and 2D dot scatterplots were created to enumerate the number of positive and negative cells for each biomarker33. Threshold cutoffs depicted by horizontal and/or vertical lines were determined manually by backgating to the greyscale and multiplexed tissue images for each biomarker. Using the backgating algorithm, threshold cutoffs were manually positioned to include or exclude cells and/or cell clusters33.
Flow cytometry analysis
On day 14 or 15 after tumor injection, tumors were dissected, minced and digested with 1 mg/ml Collagenase/Dispase (Sigma-Aldrich, 10269638001) and 1X DNase I (Qiagen, 79254) at 37°C for 30 minutes. Dissociated tumor cells were filtered through a 70 μm filter to achieve a single-cell suspension before staining for flow cytometry analysis. Cells were stained using anti-CD45 Pacific Blue (BioLegend, 103126, 1:200), anti-CD3 FITC (BD Bioscience, 553062, 1:200), anti-CD8 PerCP/Cy5.5 (BioLegend,100733, 1:50), anti-CD4 ACP/Cy7 (BioLegend, 100414, 1:20), anti-H2-Kb/H2-Db FITC (BioLegend, 114605, 1:100), and Live/Dead Fixable Red Dead Cell Stain Kit (ThermoFisher, L34971, 1:1,000) for 30 minutes at 4°C in the dark.
Hybridoma supernatant containing monoclonal antibody 573 and anti-mouse IgM-APC (Jackson, 115–136-075, 1:1000), were used for MuLV envelope protein staining following previous methods34. For tumor p15E+CD8+ T cell staining, tumors were harvested at 10 days after injection. Cells were stained using anti-CD3 APC-Cy7 (Biolegend 100221, clone 17A2, 1:200), anti-CD8 FITC (ThermoFisher, MA5–16759, clone KT-15, 1:200), H-2Kb MuLV p15E Tetramer-KSPWFTTL-PE (MBL International Coporation, TB-M507–1, 1:20), and Live/Dead Amcyan (ThermoFisher, L34957, 1:1000). All flow cytometry experiments were performed using a BD LSRII Flow Cytometer. The results are collected using BD FACSDiva v.8.01 and analyzed by FlowJo v9.9.6. Gating strategies are shown in Supplementary Fig. 2.
RNA-seq analysis
RNA was isolated with Qiagen RNeasy Plus mini kit and submitted to the Yale Stem Cell Center for stranded library preparation. RNA-seq libraries were sequenced with the target of at least 2.5 × 10⁷ reads per sample. Reads were trimmed of Illumina adapters using Trimmomatic v0.3935, and aligned to reference genome mm10 using STAR aligner v2.7.3a36 with parameters –winAnchorMultimapNmax 200 –outFilterMultimapNmax 100. The repeatmasker annotation file for mm10 was obtain using UCSC table browser37. Gencode M4 was used for gene annotation. Reads falling in either annotated repeat regions or genes were counted using featureCounts v1.6.238 and differential accessibility analysis was performed with DESeq2 v1.3239. Dfam release 3.340 was used for annotation of transposable element families as LTR (further subtyped into ERV1, ERVK, ERVL) SINE, LINE, or DNA.
Inverted repeats and MMVL30 analyses
To find de novo transcripts, the fastq files of all wild-type and knock-out replicates were first merged and aligned with STAR v2.7.3a. Stringtie v2.1.441 was then used to call de novo transcripts. Reads falling within de novo transcripts were counted with featureCounts v1.6.2 and differential expression was determined with DESeq2 v1.32. We were only interested in inverted repeats of significantly increased or decreased transposable elements, so only de novo transcripts significantly changed (adjusted p-value < 0.05) in expression were kept. Repeat masker annotation was then used to find repeats with at least an 80% overlap with these transcripts. Differentially expressed transcripts overlapped with 93,807 repeat element loci. We next found repeat element pairs where the end of the upstream repeat and start of the downstream repeat is less than 1,000 bp. Each element was allowed to form multiple pairs. After removing overlapping pairs, there were 206,116 unique pairs of repeat elements. Each pair was aligned in reverse complement manner using the exonerate tool v2.2.0 with parameters -m affine:local -s 500. We found 205 pairs of inverted repeats, with 135 of which significantly decreased and 70 of which significantly increased in expression.
To identify the expressed full-length MMVL30 loci, we first selected de novo transcripts that overlapped MMVL30-int annotations. These transcripts were then aligned using exonerate with parameters -m affine:overlap -E y -S no. The single transcript with the highest number of total alignments was chosen as the full-length MMVL30 transcript. 64 separate transcripts map to this full-length MMVL30 and these transcript loci were used for metagene profile plots.
Identification of putative TE-encoded peptides
To identify potential peptides that bind to MHC I, we first selected all TE loci that were significantly induced in KDM5B knock-out compared to wild-type (log2 fold change > 0, adjusted p-value < 0.05). ORFs within these induced TE loci were predicted using the findMapORFs function from R package ORFik42 with parameter minimumLength = 20. A total of 3,231 ORFs were found. Translated ORF sequences were used as input for NetMHC v4.043,44 to predict MHC I binding affinities of 8-mer and 9-mer peptides for H2-Kb and H2-Db, respectively. Peptides with rank < 0.1 were classified as strong binders.
MHC Class I peptide exchange procedures
H2-Kb exchange was performed according to the standard procedures described in MBL international QuickSwitch Quant Tetramer kit (MBL, #TB-7400-K1). Briefly, 50 μL of QuickSwitch tetramer was mixed with 1 μL of 1 mM peptide and 1 μL of Peptide Exchange Factor, and incubated for 4 h at room temperature. Quantification of peptide exchange rate were performed and calculated following the kit data sheet with flow cytometric sandwich immunoassay.
Chromatin Immunoprecipitation (ChIP)
Cells in 15 cm plates were washed with PBS, then cross-linked with 19 ml of fresh DMEM/F12+1% formaldehyde for 10 minutes with gentle swirling at room temperature. 1 ml of 2.5 M glycine was added to achieve final concentration of 0.125 M in 20 ml and incubated at room temperature for another 5 minutes to quench the cross-link reaction. Cells were scraped in quenched medium into 50 ml tube. P150 plate was washed with 20 ml cold 1x PBS and remaining cells were scraped and transferred to 50ml tube. Cells were pelleted with 1000xg for 3 min at 4°C and washed two more times with cold PBS on ice. 1×10⁸ pelleted cells were resuspended in 1 ml sonication buffer (20mM Tris, pH8.0, 2mM EDTA, 0.5mM EGTA, 1x protease inhibitors, 0.5% SDS and 0.5mM PMSF) and incubated on ice for 5–10 min (To remove bubbles if needed, 1–2 μl of PMSF can be added to top of the solution for each tube). Cells in sonication buffers were flash frozen in liquid N2 and stored in −80°C or proceeded to sonication directly. Cells in sonication buffers were further diluted 3 times with sonication buffer to achieve final 3.3× 10⁴ cells/μl and sonicated with Qsonica Q800R2 with 70% amplitude 15s on, 45s off for 35 min on total. After sonication, chromatin was centrifuged at max speed for 10 min at 4°C, and then supernatant was transferred. Aliquots to check fragment size were taken, added with elution buffer and 5 M NaCl, and incubated at 65°C overnight (or>3.5h) in water bath. 20% input was saved at −20°C. Remaining chromatins were pre-cleared with protein A/G beads. For each IP preclearing, 225 μl of diluted chromatin were incubated with 1 ml IP buffer (20mM Tris-HCl, pH8.0, 2 mM EDTA, 0.5% Triton X-100, 150 mM NaCl, and 10% glycerol) and 30 μl of protein A/G beads with rotation at 4°C for 1hour. Cleared ChIP solution were transferred to a new tube and 250 μl more IP buffer was added to dilute SDS. Primary antibodies were then added and incubated with rotation at 4°C overnight. Anti-H3K4me3 (Abcam, ab8580), anti-H3K4me2 (Abcam, ab7766), anti-H3K9me3 (Abcam, ab8898), anti-KDM5B antibody (Novus biologicals, NBP1–84352 or NB100–97821), anti-SETDB1 antibody (Proteintech, 11231–1-AP) or normal rabbit IgG control (CST, #2729) were used. Next day, protein A/G beads were washed three time with IP buffer. 30 μl of protein A/G slurry were then added to each IP reaction and incubated with rotation at 4°C for 2h. After rotation, the beads were washed 1 time with low salt wash buffer (10 mM Tris-HCl pH8.0, 2 mM EDTA, 1% Triton X-100, 150 mM NaCl, 0.1% SDS), 3 times with high salt wash buffer (10mM Tris-HCl pH8.0, 2 mM EDTA, 1% Triton X-100, 500 mM NaCl, 0.1% SDS), 1time LiCl wash (10mM Tris-HCl pH8.0, 2 mM EDTA, 250 mM LiCl, 1% NP40, and 1% sodium deoxycholate) and 2 times with TE buffer wash. DNA was eluted with elution buffer (100 mM NaHCO3, 1% SDS) and shaked at 65°C at 1,400 rpm for 20 min. 5M NaCl was added to the elution and incubated at 65°C overnight. 1M Tris-HCl pH8.0, glycogen, and proteinase K were added and incubated at 50°C for 1h to reverse crosslinking. DNA was extracted with phenol:chloroform:isoamyl alcohol (25:24:1, v/v) 3 times, precipitated with ethanol, washed, air dried and resuspended in 100 μl H2O. ChIP-qPCR analyses were performed using primers described in Supplementary Table 18. For ChIP-seq experiments, 50 ng of spike-in chromatin (active motif, #53083) and 2 μg of spike-in antibody (active motif, #61686) were added into each ChIP reaction. ChIP-seq libraries were prepared with NEBNext® Ultra™ II DNA Library Prep Kit for Illumina (NEB, #E7103), and sequenced using Illumina NovaSeq S4 2×150 paired-end sequencing
ChIP-seq analysis
Reads were trimmed of adaptor sequences using Trim galore v0.6.645, and aligned to either reference genome mm10 or dm6 using Bowtie2 v2.4.246 with parameters –no-mixed –no-discordant -X 2000 -N 1 -L 25. Duplicate and low-quality reads were filtered using SAMtools v1.1247 with parameters -F 1804. Individual replicates and their respective inputs were used to generate a consensus peak set. For each replicate, peaks were first called using MACS3 v3.0.0a648 with parameters -f BAMPE –broad –broad-cutoff 0.1 –nomodel. Peaks that overlapped between replicates were then kept and merged to obtain a consensus peak set for each ChIP target. For signal correlation, reads that fall within consensus KDM5B peaks or MMVL30 annotated loci were first counted with featureCounts v1.6.2 for both ChIP target or input replicates, and log2 signal:input was calculated for each region. For analysis of scaled data, replicates were combined prior to alignment and filtering. Bigwig files were generated using deepTools v3.1.349 and signal was normalized between KO and WT conditions using dm6 reads. Heatmaps were generated using deepTools function plotHeatmap or using R package ComplexHeatmap v2.4.350. For metagene profiles, bigwig signal at 64 MMVL30 regions (see Inverted Repeats and MMVL30 analyses) were averaged using bwtool v1.0 aggregate51. To find sequence motifs enriched in KDM5B binding sites, HOMER v4.10.4 findMotifsGenome.pl52 was used with parameter -size given. Signal correlation was determined with two-tailed Pearson test.
ATAC-seq analysis
For ATAC-seq experiments, 50,000 cells of WT or Kdm5b−/− YUMMER1.7 cells were tagmented following procedures described previously53. Reads were trimmed of adaptor sequences using Trim galore v0.6.6, and aligned to reference genome mm10 using Bowtie2 v2.4.2 with parameters –no-mixed –no-discordant -X 2000 -N 1 -L 25. Duplicate and low-quality reads were filtered using SAMtools v1.12 with parameters -F 1804. To obtain the Tn5 cutsite, forward strand reads were shifted +5 bp and reverse strand reads were shifted −4 bp. For a consensus ATAC-seq peak set, peaks were first called for each replicate using MACS3 v3.0.0a6 with parameters –nomodel -s 1 –shift −75 –extsize 150. All replicate peaks were then merged for downstream analyses. For differential accessibility analysis, reads in the consensus peak set were counted for each replicate and analyzed with DESeq2 v1.32 using total library sizes as the size factors. To find sequence motifs enriched in gained ATAC-seq regions, significant, differential (adjusted p-value < 0.05) ATAC-seq regions that overlap the noted conditions were used as foreground, and all other ATAC-seq regions within the consensus peak set were used as background.
Patient dataset analysis
Gorilla Gene Ontology (GO) analysis was used to identify the GO pathways of the top 365 genes negatively correlated with KDM5B from The Cancer Genome Atlas (TCGA) melanoma dataset. The raw fastq files for gene expression profiling of pembrolizumab-treated patients were downloaded from Hugo et al5. ERV fasta was downloaded from Tokuyama et al54. Fastq files were aligned to a combined fasta file with ERV and gencode fasta sequences using Salmon v0.99.055. Raw read counts were normalized using variance stabilizing transformation (VST). VST values were used for box plots and correlation. Scaled VST values were plotted for expression heatmap. TCGA gene expression data were downloaded using cBioportal R package “cBioPortalData”. RNA-seq values are in log2RSEM. Gene expression correlations were performed with two-tailed Pearson and Spearman rank test.
Quantitative PCR (qPCR)
Total RNA extraction, cDNA reverse transcription, and RT-qPCR were performed as previously described15. DNA isolation from cytoplasmic and nuclear fraction were done following similar procedure as described previously56. Quality controls for cytosolic DNA qPCR were carried out similarly as described previously57. Mitochondrial DNA copy number analysis were performed as previous described58. Primers for qPCR experiments are listed in Supplementary Table 18.
Co-Immunoprecipitation
Endogenous Co-IP was conducted with nuclear extracts prepared with NE-PER extraction reagents (Thermo Scientific, 78833) and further diluted 4 times with IP buffer (50 mM Tris-HCl pH8.0, 0.01% sodium deoxycholate, 150 mM NaCl, 1% Triton X-100, 1 x complete protease inhibitor (Roche, 11873580001) and 1x PhosSTOP (Sigma-Aldrich, 4906845001). Pre-clearing nuclear extracts with protein A/G beads were done before incubating with anti-KDM5B antibody (Novus biologicals, NB100–97821) or anti-SETDB1 antibody (Proteintech, 11231–1-AP) at 4°C overnight. Protein A/G beads were added and further incubated for 2 hours. The beads were washed with IP buffer 5 times, then 25ul of 2x SDS loading buffer was added and the samples were boiled at 95–100°C for 5 min.
Statistics and Reproducibility
Statistical analyses were conducted using R v4.0.2 or Prism 7 (GraphPad), which were also used to generate the plots. For box plots, center line denotes median; box limits denote upper and lower quartiles; whiskers denote1.5x interquartile range; points outside whiskers are outliers. No statistical methods were used to predetermine sample size. Western blot analyses, immunofluorescence staining, immunohistochemical staining and qPCR analyses have been repeated at least twice with consonant results. Animal experiments have been repeated as indicated in the figure legends. Statistical analysis for all tumor growth curves was performed with two-way repeated measures ANOVA followed by Sidak’s multiple comparisons test; the significance at the last time point is shown. Log-rank (Mantel–Cox) tests were used for tumor survival curve statistical analyses. p values for all qPCR were calculated with unpaired two-sided Student’s t-test.
Extended Data
Extended Data Figure 1. KDM5B expression is negatively correlated with anti-tumor immunity, and depletion of KDM5B in mouse melanoma tumor cells induces strong anti-tumor immunity and enhances response to anti-PD-1 treatment.

A, Spearman correlation coefficient scores of selected genes negatively correlated with KDM5B gene expression from the melanoma TCGA dataset, categorized by their functions. B, Box plot showing expression levels of CD8A, CD8B, IFNG, TNF, CXCL9 and CXCL10 in melanoma patient samples from the TCGA dataset are higher in “KDM5B low” group (lowest quartile) than in “KDM5B high” (highest quartile) group. Statistical significance was computed with the unpaired two-sided Student’s t test. c, Immunofluorescence staining of pre-treatment melanoma samples with a melanoma cocktail (S100, HMB45 -green), KDM5B (red), and DAPI (blue). Images A-C are representative images from 3 independent non-responders to anti-PD-1 treatment; Images D-F are representative images from 3 independent responders. Cell-specific KDM5B expression levels of KDM5B and melanoma markers in the tumor microenvironment are displayed in 2D dot plots in non-responders (G) and responders (H). Each dot represents the mean fluorescent intensities of a single cell for KDM5B and the melanoma marker cocktail. Cells that are positive for both KDM5B and melanoma marks are in the upper right quadrants. (I) displays the frequency and distribution of expression levels of KDM5B in responders (green) and non-responders (red). MGLI= mean grey level intensity. Cutoff values for positive settings are denoted by the horizontal and vertical bars. Scale bar=100 μm. d, Survival curves of C57BL/6 mice subcutaneously injected with 500,000 control (black) (n=6) or Kdm5b−/− (Kdm5b sg) (red) (n=6) YUMMER1.7 cells. Mice injected with Kdm5b−/− cells had completely regressed tumors, and were re-challenged with control tumor cells on day 45 after initial tumor injection. Data are representative of two independent experiments. Log-rank test for survival curves, **p=0.004. e, Tumor growth curves of C57BL/6 mice injected with polyclonal YUMMER1.7 cells with stable lentiviral Ctl sg (n=5), Kdm5b sg1 (n=5) or Kdm5b sg2 (n=5), with western blot analyses (insert) showing knockout efficacy of KDM5B. Data are representative of two independent experiments. Data are mean ± SEM. 2-way ANOVA analysis for comparison at day 18 after tumor injection, ****p<0.0001. For gel source data, see Supplementary Fig. 1. f, Representative images of immunofluorescent staining of CD3 (green), Melan A (red) and DAPI (blue) (left) and Quantification of CD3+ cells per view field (3–5 view fields per tumor; each dot represents the mean for each tumor; 5 tumors per group) (right) from Ctl, Kdm5b sg1 and Kdm5b sg2 YUMMER1.7 tumors harvested at day 14 after injection. scale bar=200 μm. Quantification data are mean ± SD; Unpaired two-sided Student’s t-test, **p= 0.0081 for Ctl vs sg1; **p=0.0063 for Ctl vs sg2. g, Quantitation of the percentages of CD4+ and CD8+ cells in total CD45+ immune cells using flow cytometry analysis of control and Kdm5b sgRNA tumors. Unpaired two-sided Student’s t-test for each comparison, *p=0.036 for CD4+%; *p=0.024 for CD8+%. Data are representative of two independent experiments. Data are mean± SD. h, Representative flow cytometry plots showing CD8+ T cells in Ctl and Kdm5b sg YUMMER1.7 tumors harvested at day 14 after tumor injection. i. Representative immunohistochemical staining of CD8 (CD8+ T cells) and cleaved caspase-3 in control and Kdm5b sg YUMMER1.7 tumors at day 14 after injection. scale bar=100 μm. Data are representative of three independent experiments. j,k, Tumor growth curves (j) and survival curves (k) of C57BL/6 mice injected with single clones of Kdm5b−/− YUMMER1.7 cells, WT (n=5), 1G8 (n=5), 4B5 (n=5), 4H1(n=5) and 4H3(n=5) are clone numbers. Statistical significance of tumor growth curves was analyzed with 2-way ANOVA, ****p<0.00001. Data are representative of two independent experiments. Data are mean± SEM. Statistical significance of tumor survival was analyzed with log-rank (Mantel-Cox) test. **p=0.0018. l, Tumor growth curves of wild-type C57BL/6J (B6) mice injected with control (Ctl) (n=4) or Kdm5b−/− (Kdm5b sg) (n=4) YUMMER1.7 cells or Rag1−/− mice injected with control (n=5) or Kdm5b−/− YUMMER1.7 cells (n=4). Data represent one experiment. Data are mean ± SEM. ****p<0.0001. m, Tumor growth curves of WT (n=5) and Kdm5b−/− YUMM1.7 (n=4) in Rag1−/− mice. Western blot of the cell lines is shown on the right. Data represent one experiment. Data are mean ± SEM. 2-way ANOVA analysis for comparison at day 25 after tumor injection, ****p<0.0001. For gel source data, see Supplementary Fig. 1. n, Tumor growth curves of C57BL/6J (B6) mice that rejected Kdm5b−/− YUMMER1.7 tumors (Challenged B6) rechallenged with YUMM1.7 (n=6) or Kdm5b−/− YUMM1.7 (n=5) cells compared with age matched Naïve B6 mice injected with YUMM1.7 (n=5) or Kdm5b−/− YUMM1.7 (n=5) cells. Data represent one experiment. Data are mean ± SEM. 2-way ANOVA analysis for comparison of tumor size at day 25. n.s., not significant; ****p<0.0001. o, Survival curves of C57BL/6J (B6) mice that rejected Kdm5b−/− YUMMER1.7 tumors (Challenged B6) rechallenged with Kdm5b−/− YUMM1.7 cells and treated with anti-CD8 antibody (n=4) or IgG control (n=4). Data represent one experiment. Statistical significance of tumor survival was analyzed with log-rank (Mantel-Cox) test. **p=0.0067. p, Tumor growth curves of C57BL/6 mice injected with wild-type YUMM1.7 cells treated with IgG control (n=10) or anti-PD-1 antibody (n=10); or Kdm5b−/− YUMM1.7 cells treated with IgG control (n=9) or anti-PD-1 antibody (n=10). Data are representative of two independent experiments. Data are mean ± SEM. 2-way ANOVA analysis for comparison at day 18. n.s., not significant; ****p<0.0001. q, Spider plots of tumor growth data shown in p.
Extended Data Figure 2. Depletion of KDM5B in mouse melanoma cells activates the type I interferon response through both RNA and DNA sensing pathways.
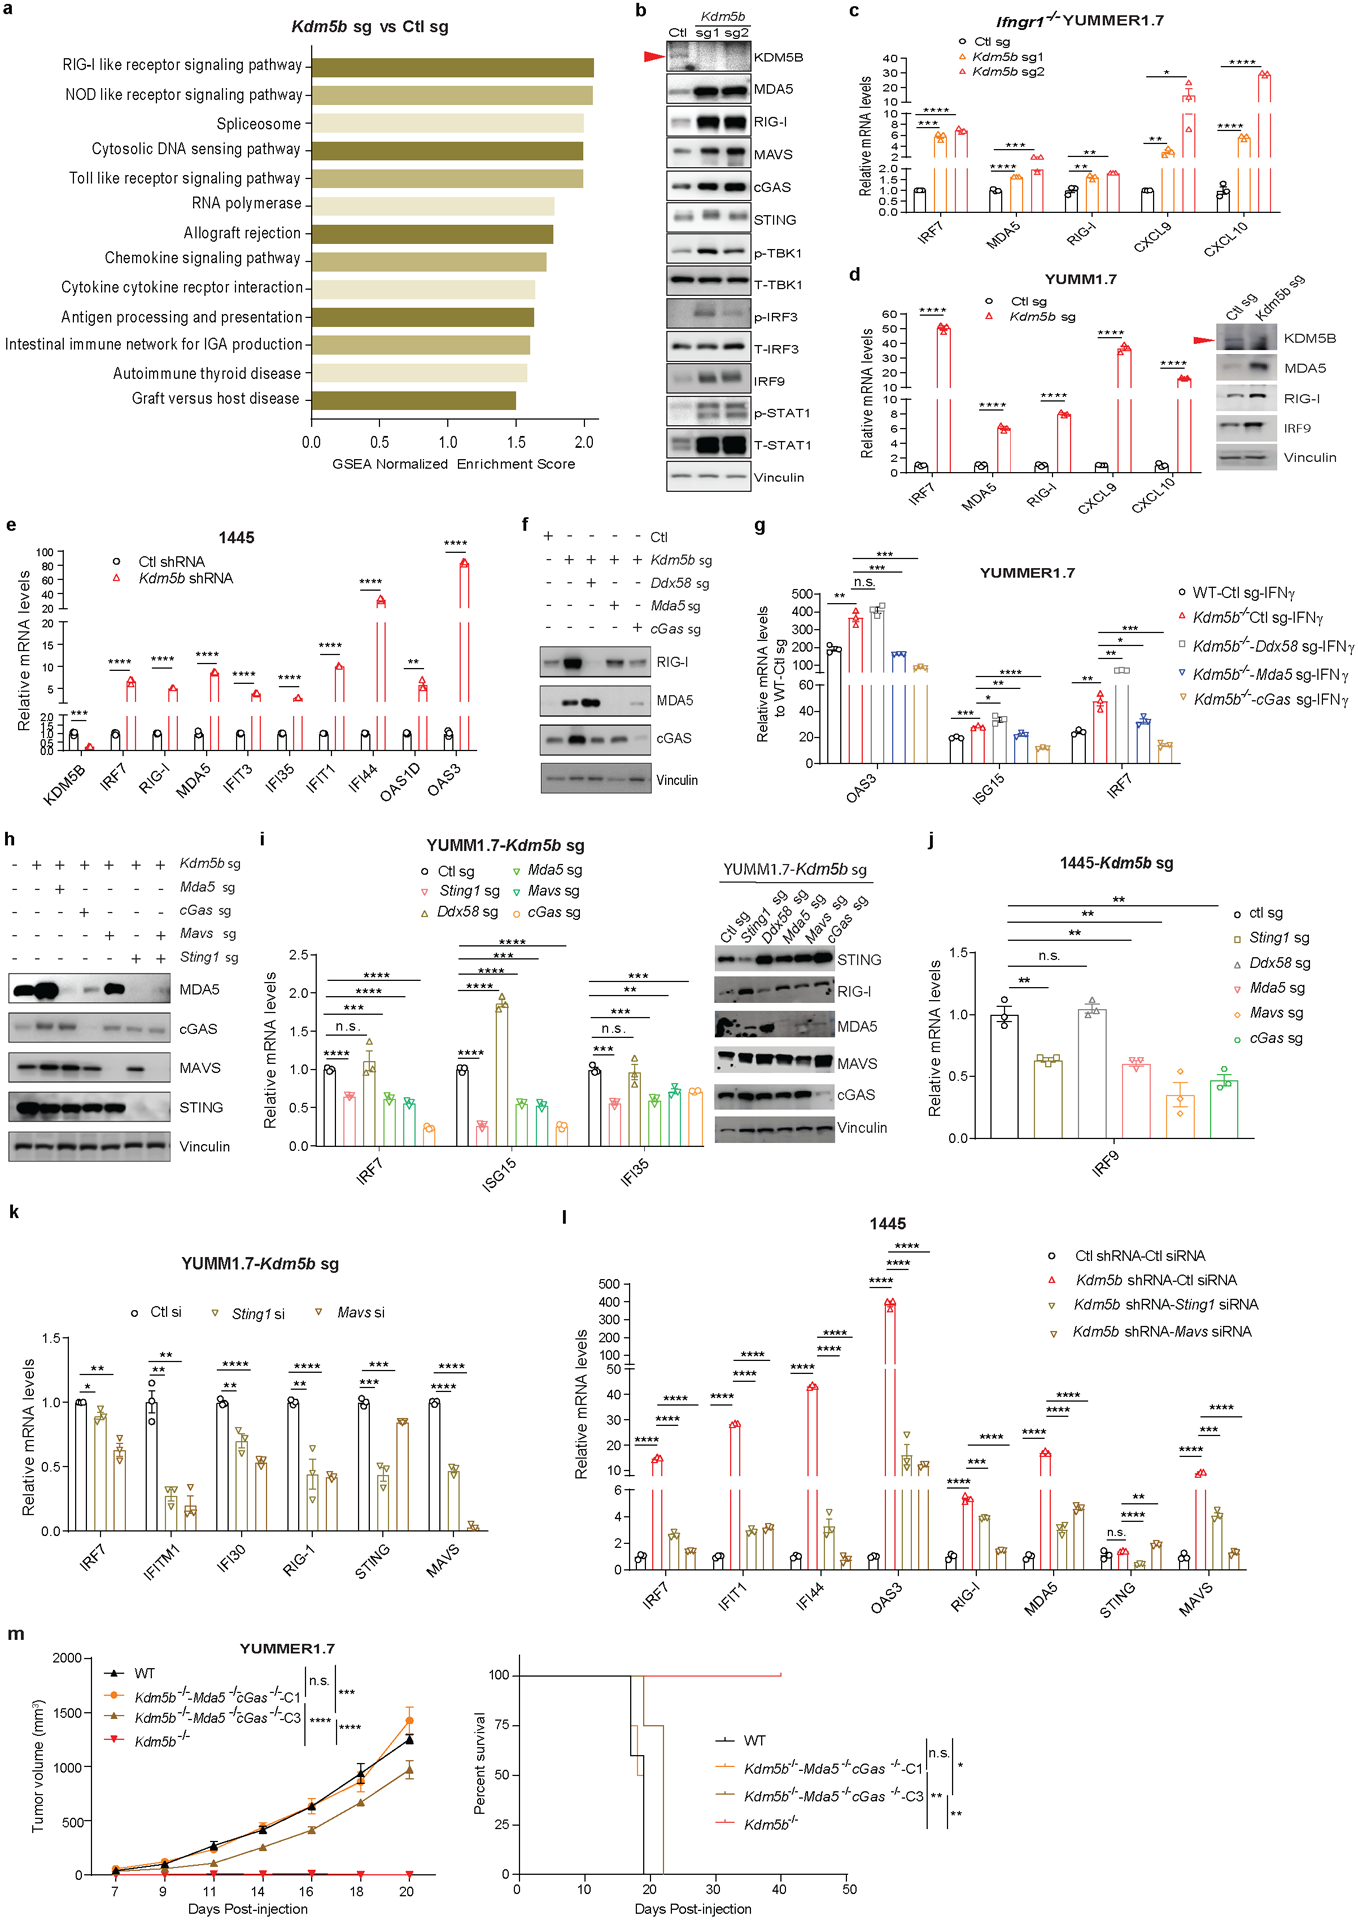
a, GSEA comparing RNA-seq data from Kdm5b−/− (Kdm5b sg) YUMMER1.7 cells with control YUMMER1.7 cells. Shown are selected top upregulated pathways (FDR<=0.05). b, Western blot analyses of DNA and RNA sensors, as well as signaling proteins involved in the type I IFN pathway. T-, total; p-, phosphorylated. For gel source data, see Supplementary Fig. 1. c, RT-qPCR analyses of ISGs in Ifngr1−/− YUMMER1.7 mouse melanoma cells with Ctl sg, Kdm5b sg1 and Kdm5b sg2. d, RT-qPCR analyses of ISGs (left) and western blot analyses (right) of YUMM1.7 mouse melanoma cells with Ctl sg and Kdm5b sg. For gel source data, see Supplementary Fig. 1. e, RT-qPCR analyses of ISGs in 1445 mouse melanoma cells with Ctl shRNA and Kdm5b shRNA. f, Western blot analyses of the indicated cell lines used in Figure 2b and Exteneded Data Figure 2g. For gel source data, see Supplementary Fig. 1. g, RT-qPCR analyses of selected ISGs in the indicated YUMMER1.7 cells treated with 10 ng/ml IFNγ for 24h. Data are mean ± SD. h, Western blot analyses of the indicated cell lines, used in Figure 2c. For gel source data, see Supplementary Fig. 1. i, RT-qPCR analyses (left) and western blot analyses (right) of YUMM1.7-Kdm5b sg cells with Ctl sg, Sting1 sg, Ddx58 (RIG-I gene) sg, Mda5 sg, Mavs sg, or cGas sg. For gel source data, see Supplementary Fig. 1. j, RT-qPCR analyses of IRF9 in1445-Kdm5b sg cells with Ctl sg, Sting1 sg, Ddx58 sg, Mda5 sg, Mavs sg, or cGas sg. k, RT-qPCR analyses of ISGs from YUMM1.7-Kdm5b sg cells treated with Ctl siRNA, Sting1 siRNA or Mavs siRNA for 3 days. l, RT-qPCR analyses of ISGs from 1445 cells with Ctl shRNA treated with Ctl siRNA, 1445 cells with Kdm5b shRNA treated with Ctl siRNA, Sting1 siRNA, or Mavs siRNA cells for 3 days. Data are means ± SEM. m, Tumor growth curve (left) and survival curve (right) of C57BL/6 mice injected with YUMMER1.7 cells of the indicated genotypes, WT (n=5), Kdm5b−/−-Mda5−/− cGas−/−-C1 (n=4), Kdm5b−/−-Mda5−/− cGas−/−-C3 (n=4), Kdm5b−/− (n=5). C1 and C3 are clone numbers. Data represent one experiment. Data are mean ± SEM. 2-way ANOVA analysis for comparison at day 20. n.s., not significant; ****p<0.0001. Log-rank test for survival curves. **p=0.004 for C1 vs Kdm5b−/−; **p=0.005 for C3 vs Kdm5b−/−; *p=0.023 for C3 vs WT. Unpaired two-sided Students’ t tests were performed for all RT-qPCR data (c-e,g, i-l). n.s., not significant; *p<0.05; **p<0.01; ***p<0.001; ****p<0.0001.
Extended Data Figure 3. Deletion of KDM5B in mouse melanoma cells increases MHC-I expression, and induces expression of genes involved in antigen processing/presentation and endogenous retroelements.
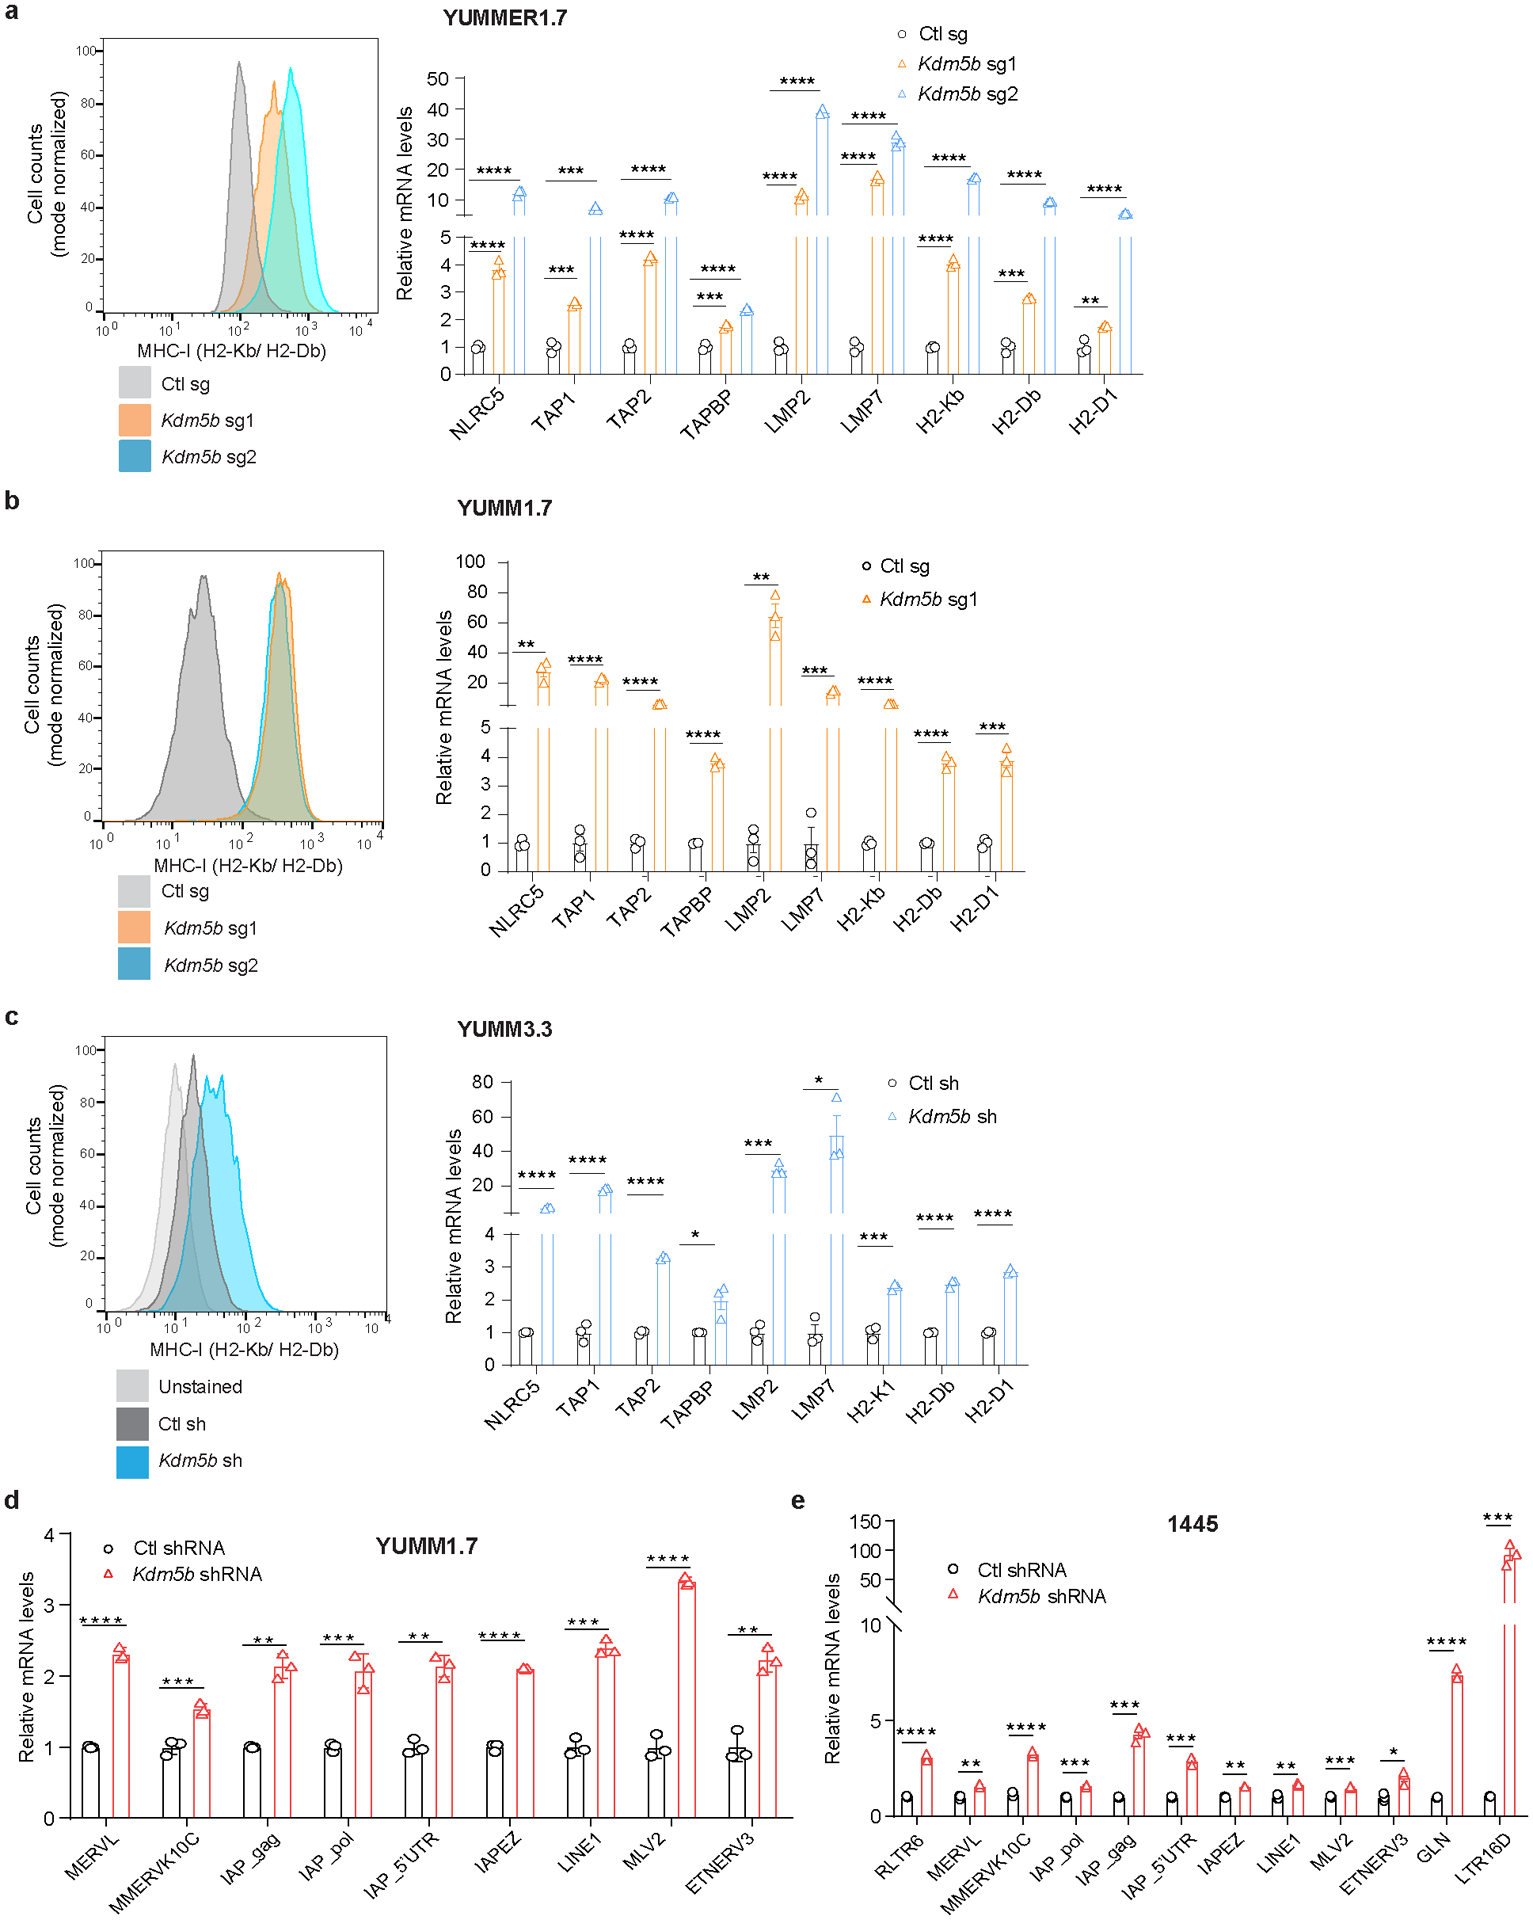
a-c, Flow cytometry analysis for MHC-I levels (left) and RT-qPCR analyses of MHC-I genes and genes involved in antigen processing and presentation (right) in YUMMER1.7 cells with Ctl sg, Kdm5b sg1 or sg2 (a), YUMM1.7 cells with Ctl sg, Kdm5b sg1 or sg2 (b), and YUMM3.3 cells with Ctl shRNA or Kdm5b shRNA (c). Data are mean ± SEM. d,e, RT-qPCR analyses of ERVs in YUMM1.7 cells (d) and 1445 cells (e) with Ctl shRNA or Kdm5b shRNA. Data are mean ± SEM. Statistical analysis was done with unpaired two-sided Student’s t test. *p<0.05, **p<0.01, *** p<0.001 and ****p<0.0001.
Extended Data Figure 4. Deletion of KDM5B induces endogenous retroelement expression and forms dsRNA.
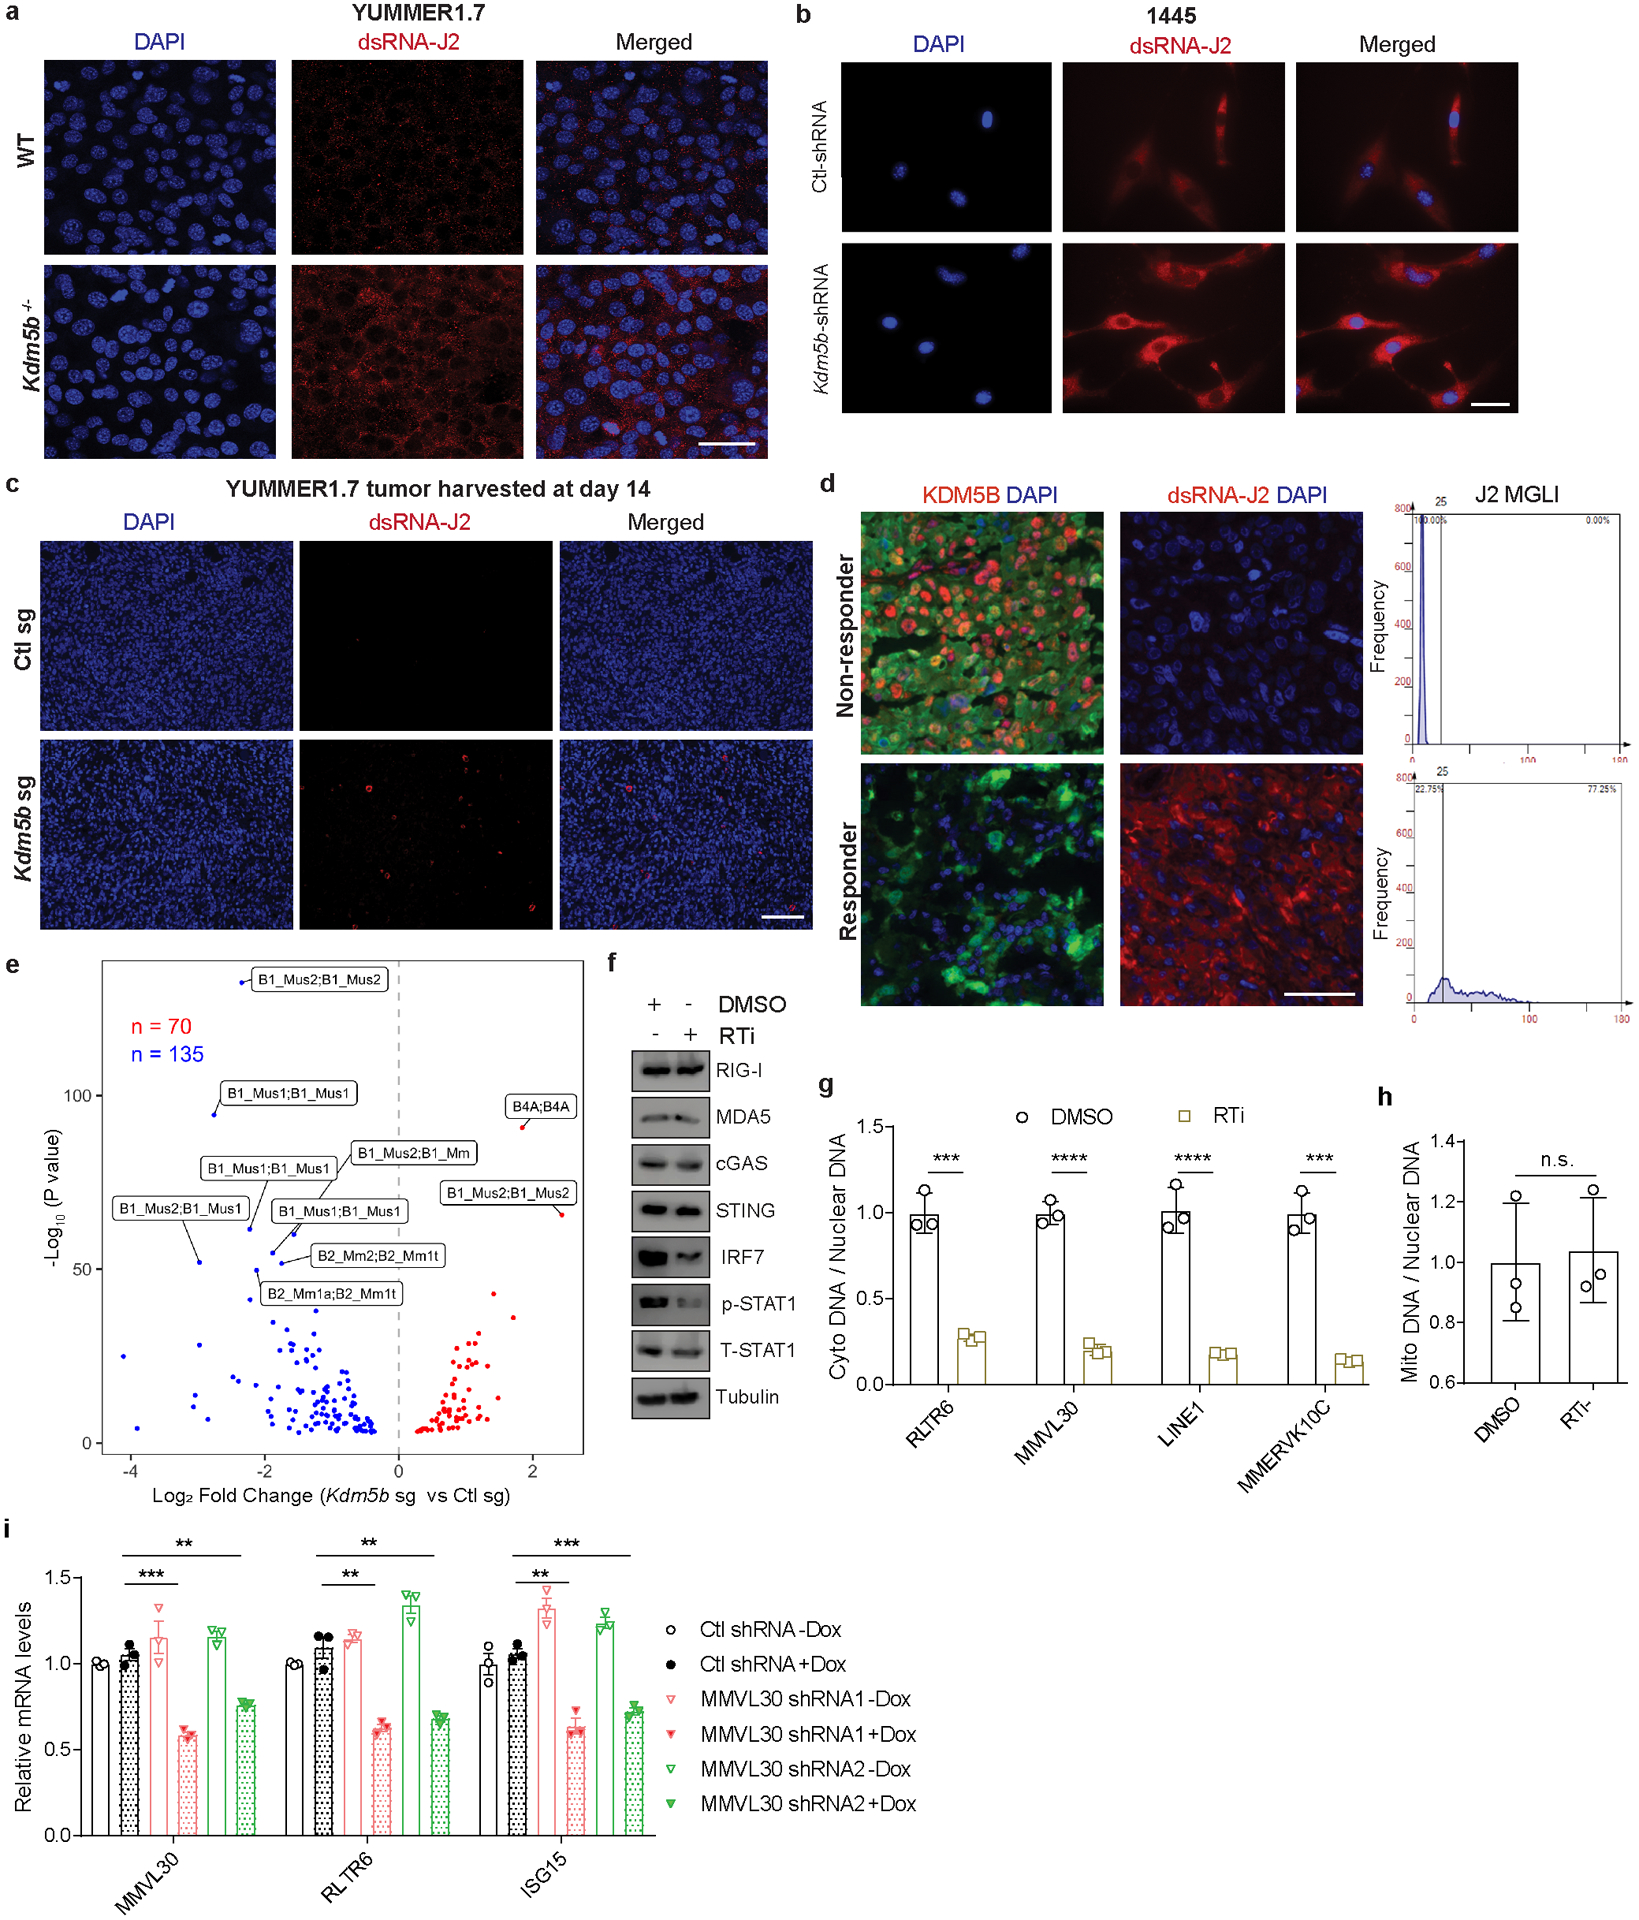
a,b, Immunofluorescence staining of dsRNA with J2 antibody (red) and DAPI (blue) in WT or Kdm5b−/− YUMMER1.7 cells, using a confocal microscope (a) (scale bar=50 μm) and 1445 cells with Ctl shRNA or Kdm5b shRNA (b) (scale bar=50 μm). c, Immunofluorescence staining of dsRNA with J2 antibody (red) and DAPI (blue) of WT or Kdm5b sg YUMMER1.7 tumors harvested 14 days after tumor injection (scale bar=100 μm). d. Immunofluorescence staining (left) and quantification (right) of dsRNA with J2 antibody (red) and DAPI (blue) of representative patients as responder or non-responder to ICB (scale bar=100 μm). MGLI= mean grey level intensity. e, Volcano plots comparing inverted repeats in YUMMER1.7 cells with Kdm5b sg vs YUMMER1.7 cells with Ctl sg. f, Western blot analyses of Kdm5b sg YUMMER1.7 cells treated with 20 μM of reverse transcriptase inhibitors (RTi) for 48h. For gel source data, see Supplementary Fig. 1. g, qPCR analyses of retroelements from DNA isolated from cytosolic (cyto) lysate versus from nuclear lysate. Data are mean ± SD. h, Relative copy number of mitochondrial (mito) DNA quantified by qPCR analyses with Dloop primers. Data are mean ± SD. i, RT-qPCR analyses of MMVL30, RLTR6 and ISG15 in Kdm5b−/− cells with the indicated doxycycline (Dox) inducible shRNAs. Data are mean ± SEM. p values for g-i were calculated using unpaired two-sided Students’ t tests. n.s., not significant; **p<0.01; ***p<0.001; ****p<0.0001.
Extended Data Figure 5. KDM5B represses retroelement expression in a demethylase-independent manner.
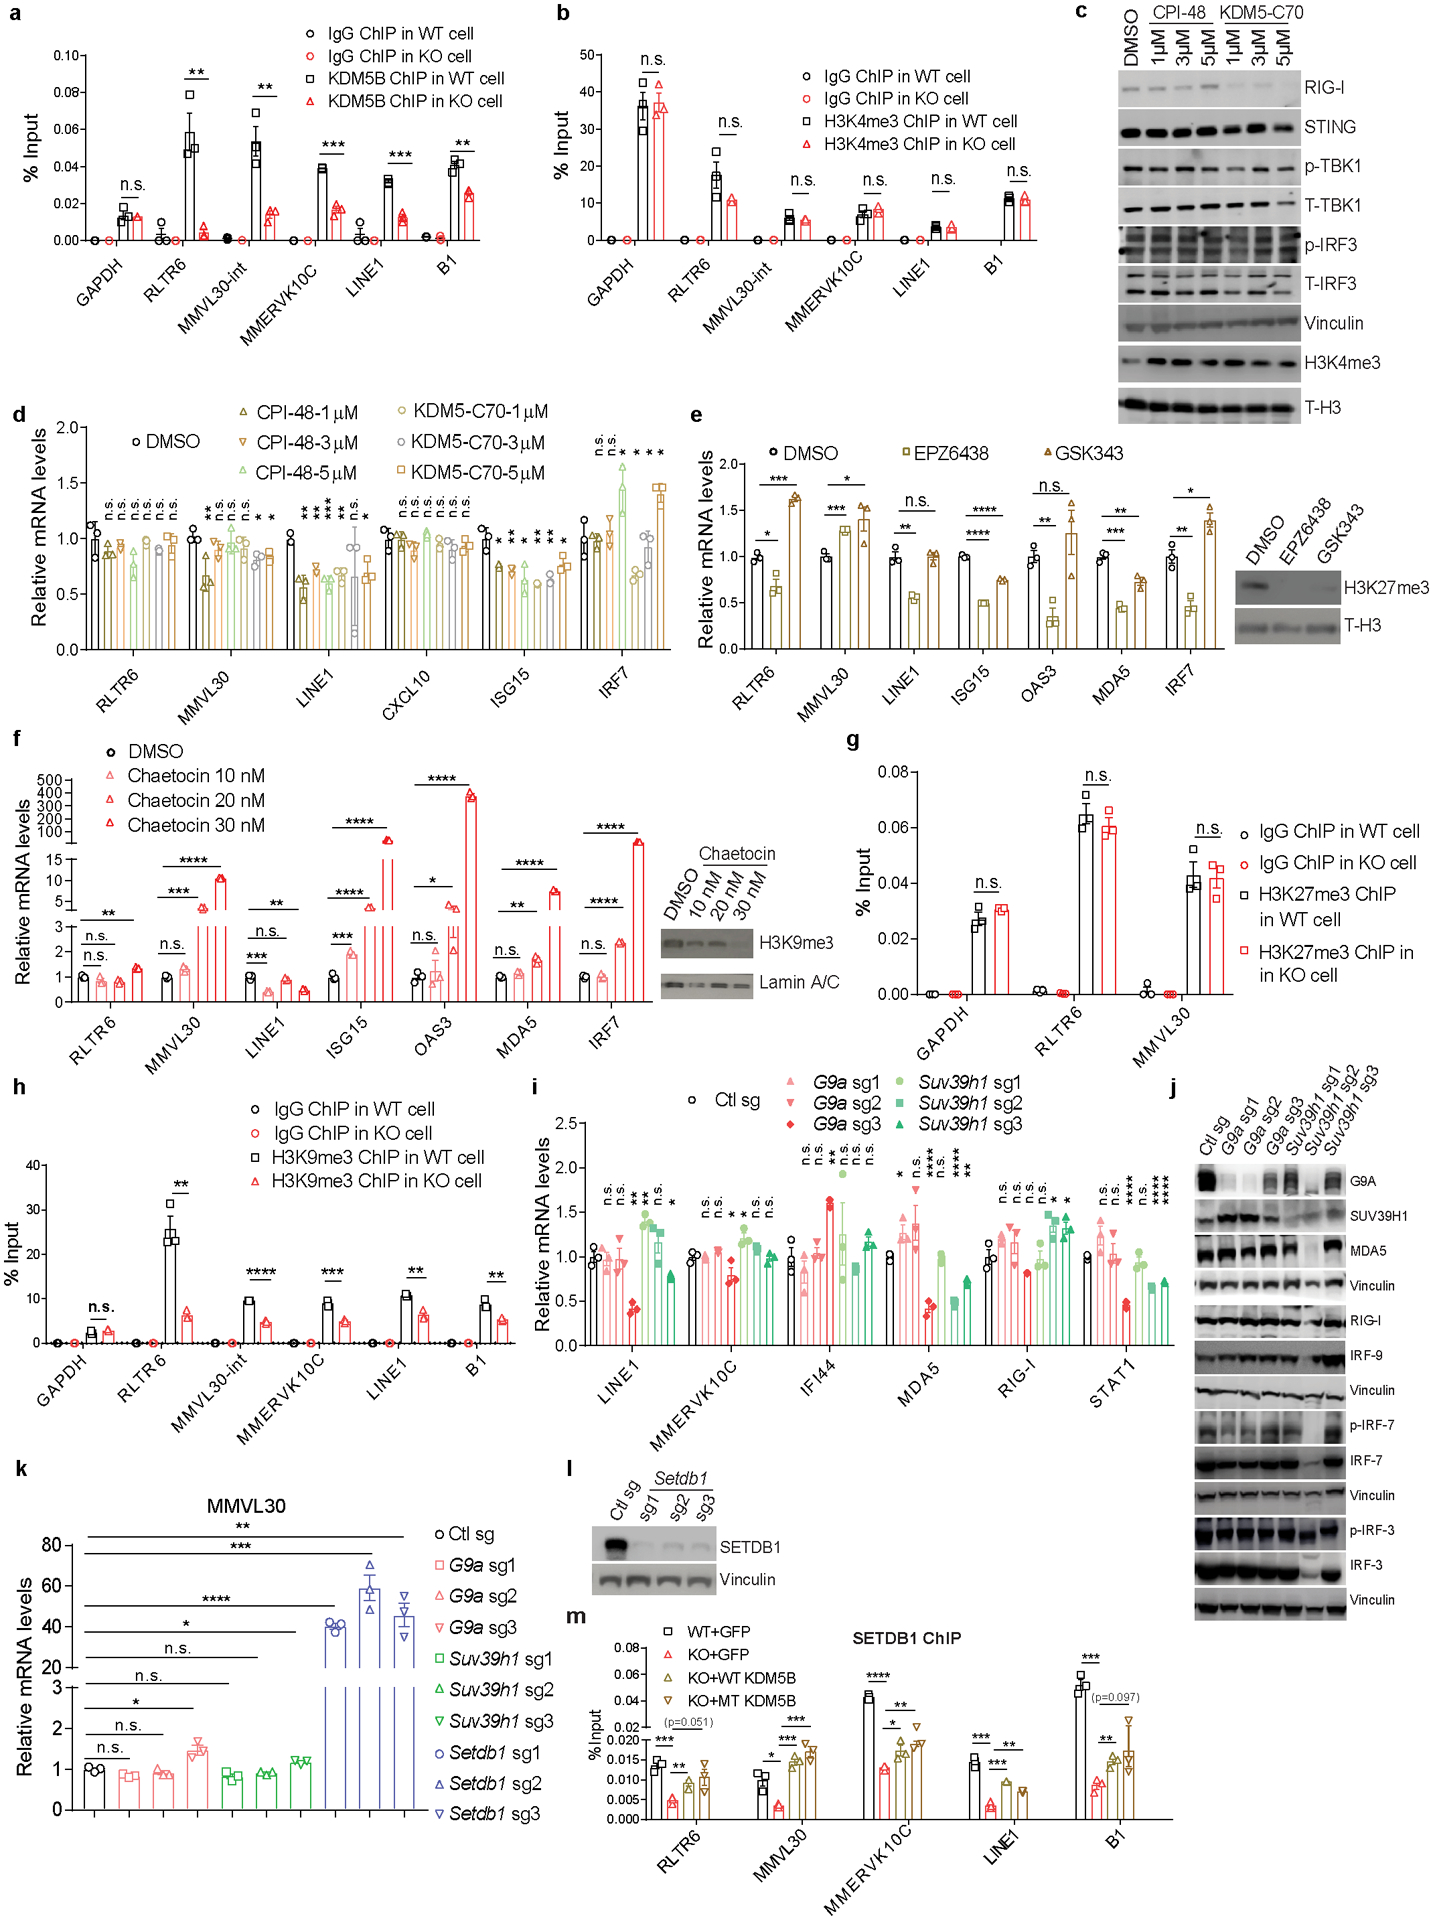
a,b, ChIP-qPCR analyses of WT and Kdm5b−/− (KO) YUMMER1.7 cells. Data are mean± SEM. c,d, Western blot (c) and RT-qPCR analyses of ERVs and ISGs (d) in YUMMER1.7 treated with 1 μM, 3 μM and 5 μM of KDM5i (CPI-48 and KDM5-C70) for 7 days. For gel source data, see Supplementary Fig. 1. e, RT-qPCR analyses of ERVs and ISGs (left) and western blot analyses (right) of YUMMER1.7 cells treated with DMSO or EZH2 inhibitors (5 μM EPZ6438, 5 μM GSK343) for 10 days. For gel source data, see Supplementary Fig. 1. f, RT-qPCR analyses (left) and western blot analyses (right) of YUMMER1.7 cells treated with DMSO or chaetocin (10, 20, and 30 nM), an inhibitor of H3K9me3 methyltransferase SETDB1, for 3 days. g,h, ChIP-qPCR analyses of WT and Kdm5b−/− (KO) YUMMER1.7 cells. i,j, RT-qPCR analyses (i) and western blot analyses (j) of YUMMER1.7 cells with Ctl sg, G9a sg (1–3) or Suv39h1 sg (1–3). For gel source data, see Supplementary Fig. 1. k, RT-qPCR analyses of MMVL30 in YUMMER1.7 cells with Ctl sg, G9a sg (1–3), Suv39h1 sg (1–3), and Setdb1 sg (1–3). l, Western blot analyses of YUMMER1.7 cells with Ctl sg or Setdb1 sg (1–3). For gel source data, see Supplementary Fig. 1. m, ChIP-qPCR analyses of WT YUMMER1.7 cells with GFP, Kdm5b−/− YUMMER1.7 cells, with GFP control, or reconstituted expression of WT-KDM5B or catalytically inactive mutant (MT) KDM5B. For a,b, d-h, i,k,m, data are means ± SEM. Statistical analysis was done with unpaired two-sided Student’s t test. n.s. not significant, *p<0.05, **p<0.01, *** p<0.001 and ****p<0.0001.
Extended Data Figure 6. KDM5B directly binds to the retroelements induced by Kdm5b loss.
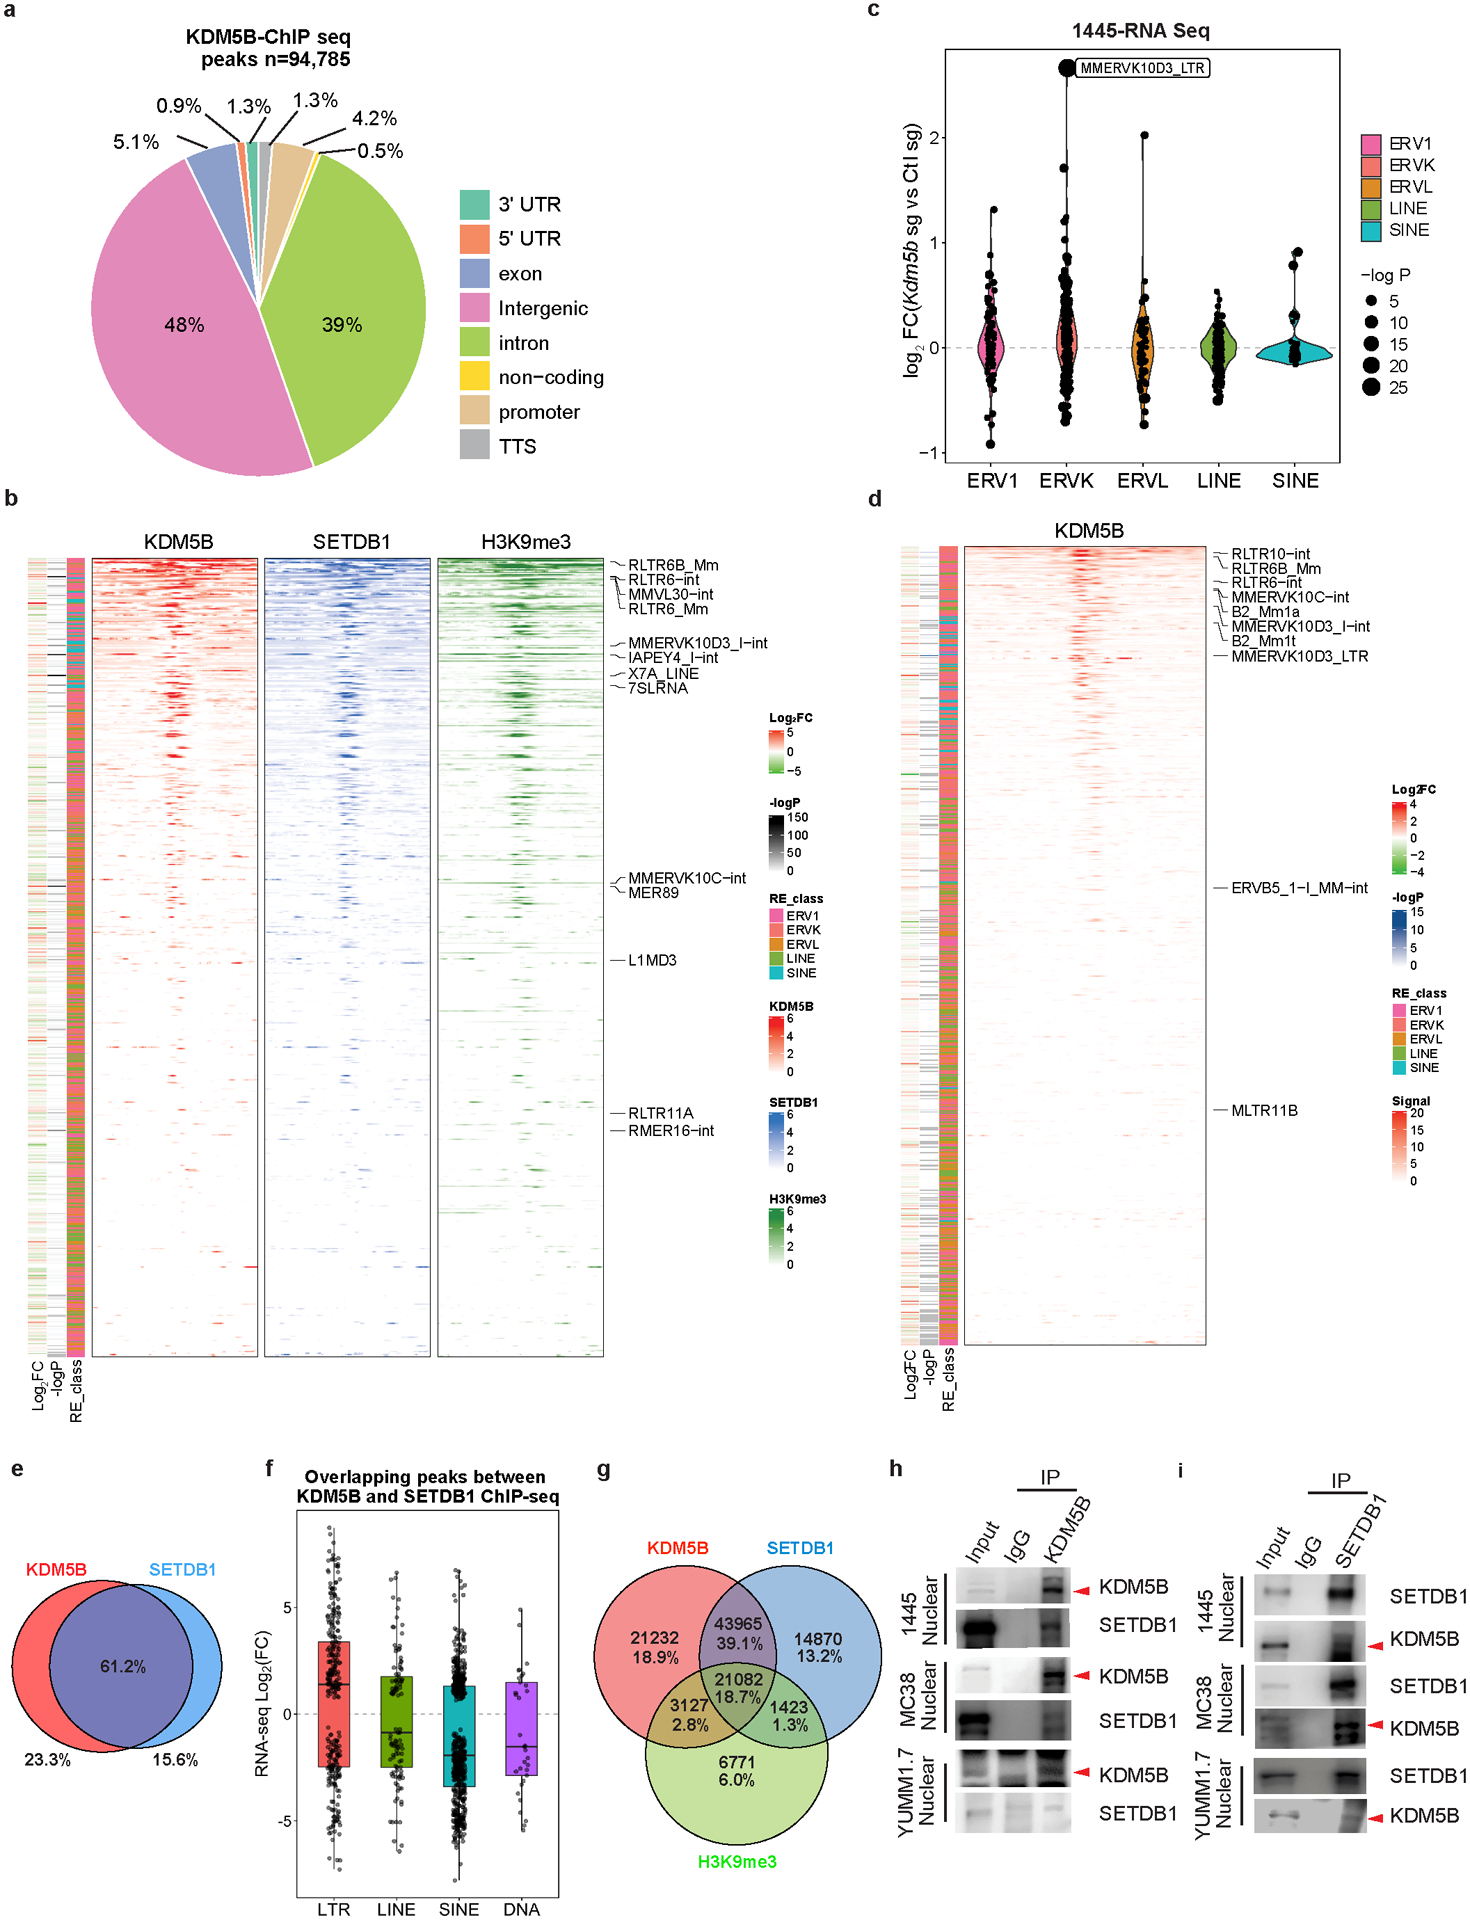
a, Genomic annotations of Kdm5b binding peaks from KDM5B ChIP-seq in YUMMER1.7 cells. b, Heatmaps of input-subtracted KDM5B, SETDB1 and H3K9me3 ChIP-seq signal averaged across all loci per retroelement in YUMMER1.7 cells, sorted by KDM5B binding intensity. Top 10 significantly increased retroelements plus “MMERVK10C-int, RLTR6-int, and RLTR6B_Mm“ are labeled. c, Violin plots of RNA-seq analysis showing differential expressed endogenous retroelements categorized in classes (three classes of ERVs, LINEs and SINEs) in 1445 mouse melanoma cells with Kdm5b sg vs. Ctl sg. d, Input-subtracted KDM5B ChIP-seq signal averaged across all loci per retroelement in 1445 cells. KDM5B signal on ERVs were sorted by intensity. Top 10 significantly increased retroelements are labeled. e, Venn diagram showing overlapping ChIP-seq binding regions shared between KDM5B and SETDB1. KDM5B only peaks, n=25,315; Shared peaks, n=66,503; SETDB1 only peaks, n=16,934. f, Box plot showing RNA-seq log2 Fold Change (FC) of (Kdm5b−/− vs WT) for four different categories of transposable elements located within overlapping regions between KDM5B and SETDB1. g, Venn diagram showing overlapping ChIP-seq binding regions shared among KDM5B, SETDB1 and H3K9me3. h,i, Western blot analyses of KDM5B (h) or SETDB1 (i) immunoprecipitates from nuclear extracts of 1445 mouse melanoma cells, MC38 mouse colon cancer cells or YUMM1.7 mouse melanoma cells. For gel source data, see Supplementary Fig. 1.
Extended Data Figure 7. ChIP-seq and ATAC-seq analyses of epigenomic changes induced by Kdm5b loss.
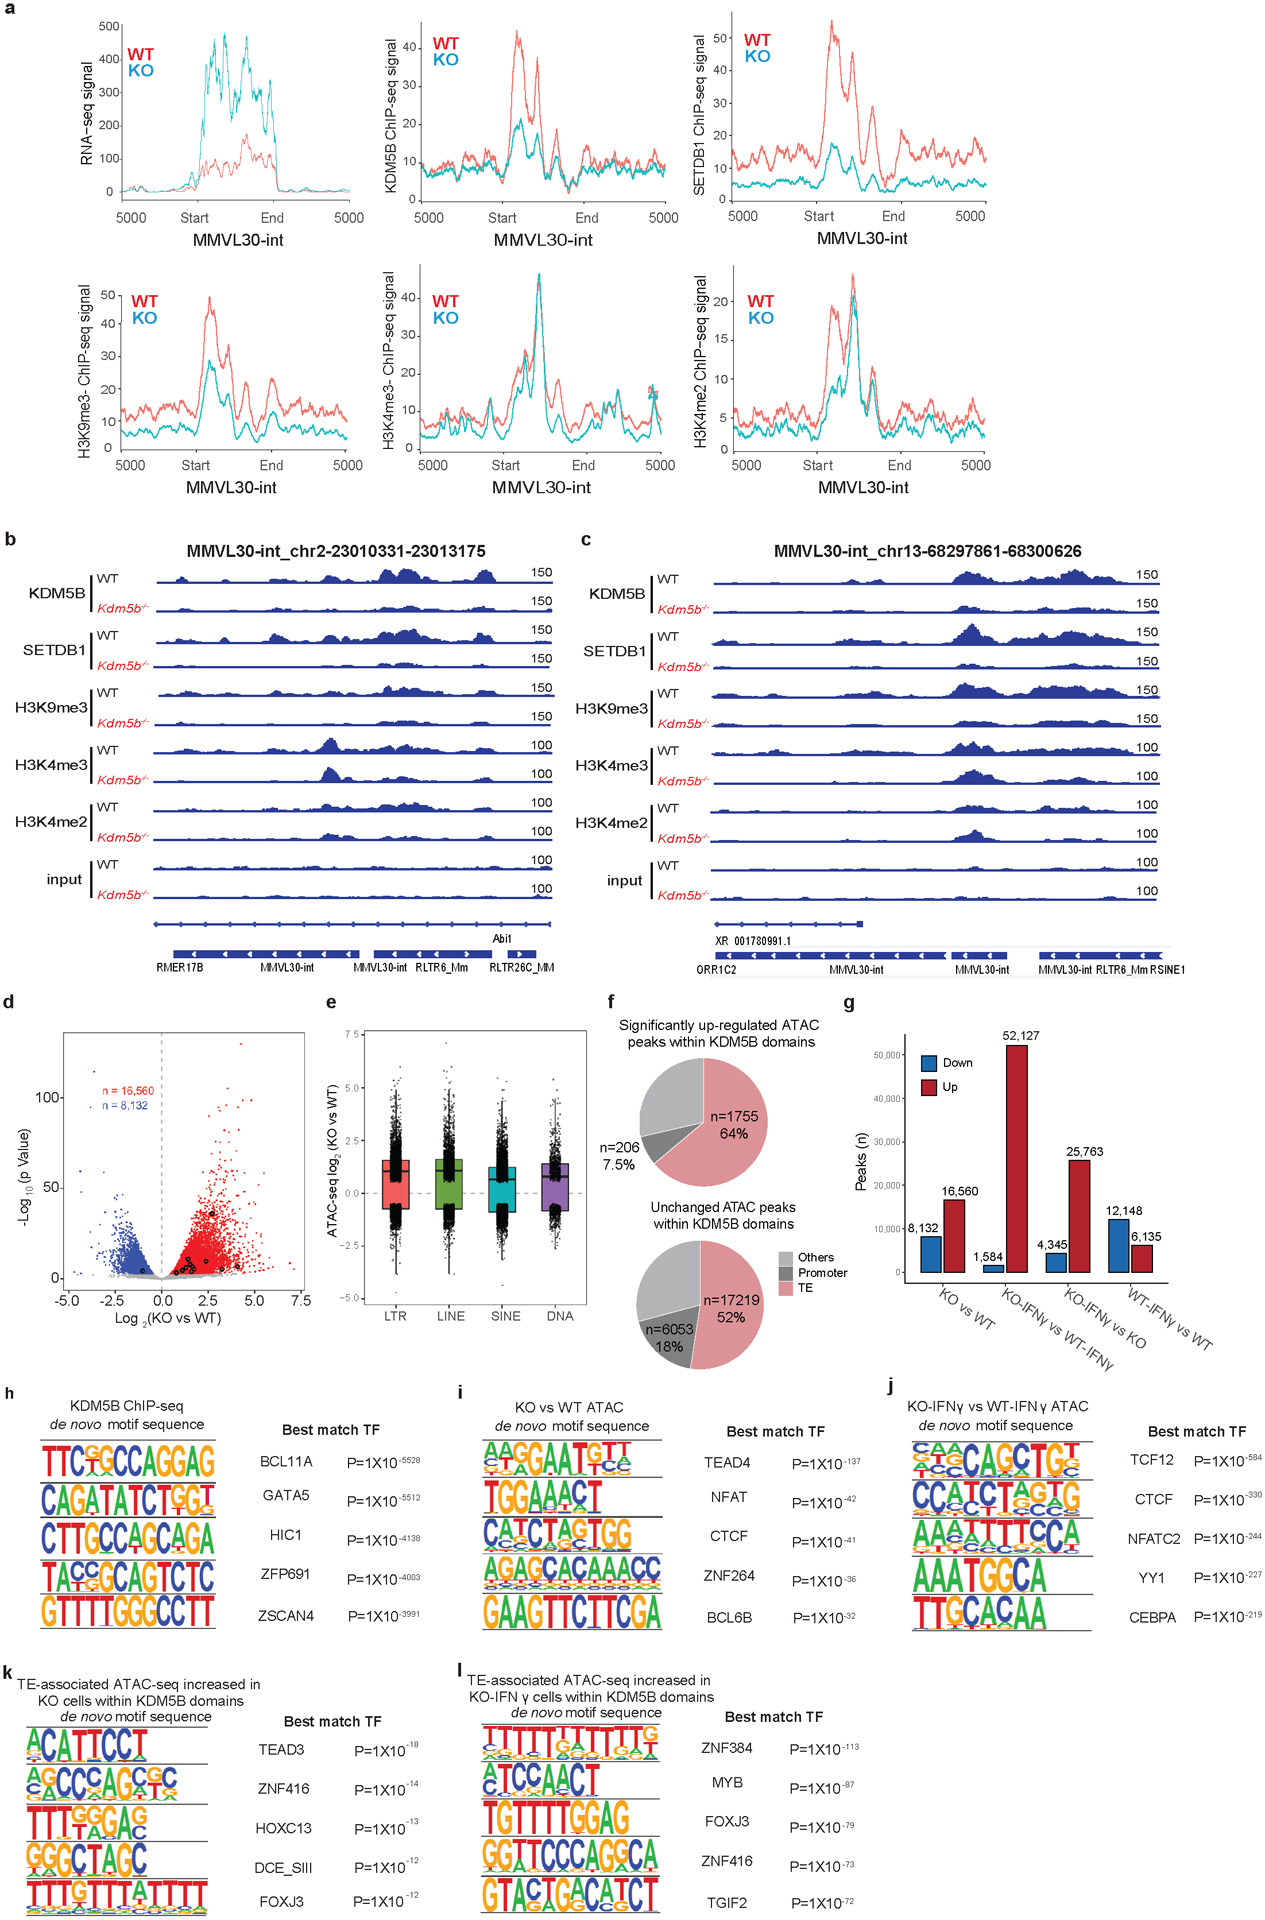
a. Aggregated RNA-seq, KDM5B, SETDB1, H3K9me3, H3K4me3 and H3K4me2 ChIP-seq signals of MMVL30-int loci in WT and Kdm5b−/− (KO) YUMMER1.7 cells. b-c. IGV (Integrative Genomic Viewer) screenshots of KDM5B, SETDB1, H3K9me3, H3K4me3, and H3K4me2 ChIP-seq signals from WT and Kdm5b−/− YUMMER1.7 cells. d. Volcano plot showing ATAC-seq signals from WT and Kdm5b−/− YUMMER1.7 cells; Peaks enriched significantly in Kdm5b−/− cells are in red and enriched significantly in WT cells are in blue (FDR < 0.05). Significant changed MMVL30-int loci are marked in black. e. Box plot showing ATAC-seq log2 Fold Change of (Kdm5b−/− vs WT YUMMER1.7) for four different categories of transposable elements. f. Pie charts showing proportion of increased or unchanged ATAC peaks within KDM5B domains in Kdm5b−/− vs WT YUMMER1.7 cells. g. Comparison of ATAC-seq signals among baseline or IFNγ treated Kdm5b−/− (KO) and WT YUMMER1.7 cells. h-l, Motif sequences (left) and top 5 best matched transcription factor (TF) with corresponding p value (right) from de novo motif analysis of KDM5B binding regions (h), increased ATAC seq peaks in Kdm5b−/− (KO) compared to WT YUMMER1.7 cells (i), increased ATAC seq peaks in IFNγ treated Kdm5b−/− compared to WT YUMMER1.7 cells (j), retroelements within KDM5B binding regions, with increased ATAC seq peaks in Kdm5b−/− cells compared to WT YUMMER1.7 cells (k), and retroelements within KDM5B binding regions, with increased ATAC seq peaks in IFNγ treated Kdm5b−/− (KO) YUMMER1.7 compared to IFNγ treated WT YUMMER1.7 cells (l).
Extended Data Figure 8. KDM5B regulates SETDB1 protein stability and is required for the recruitment of SETDB1 to retroelements, some of which encode potential antigens.
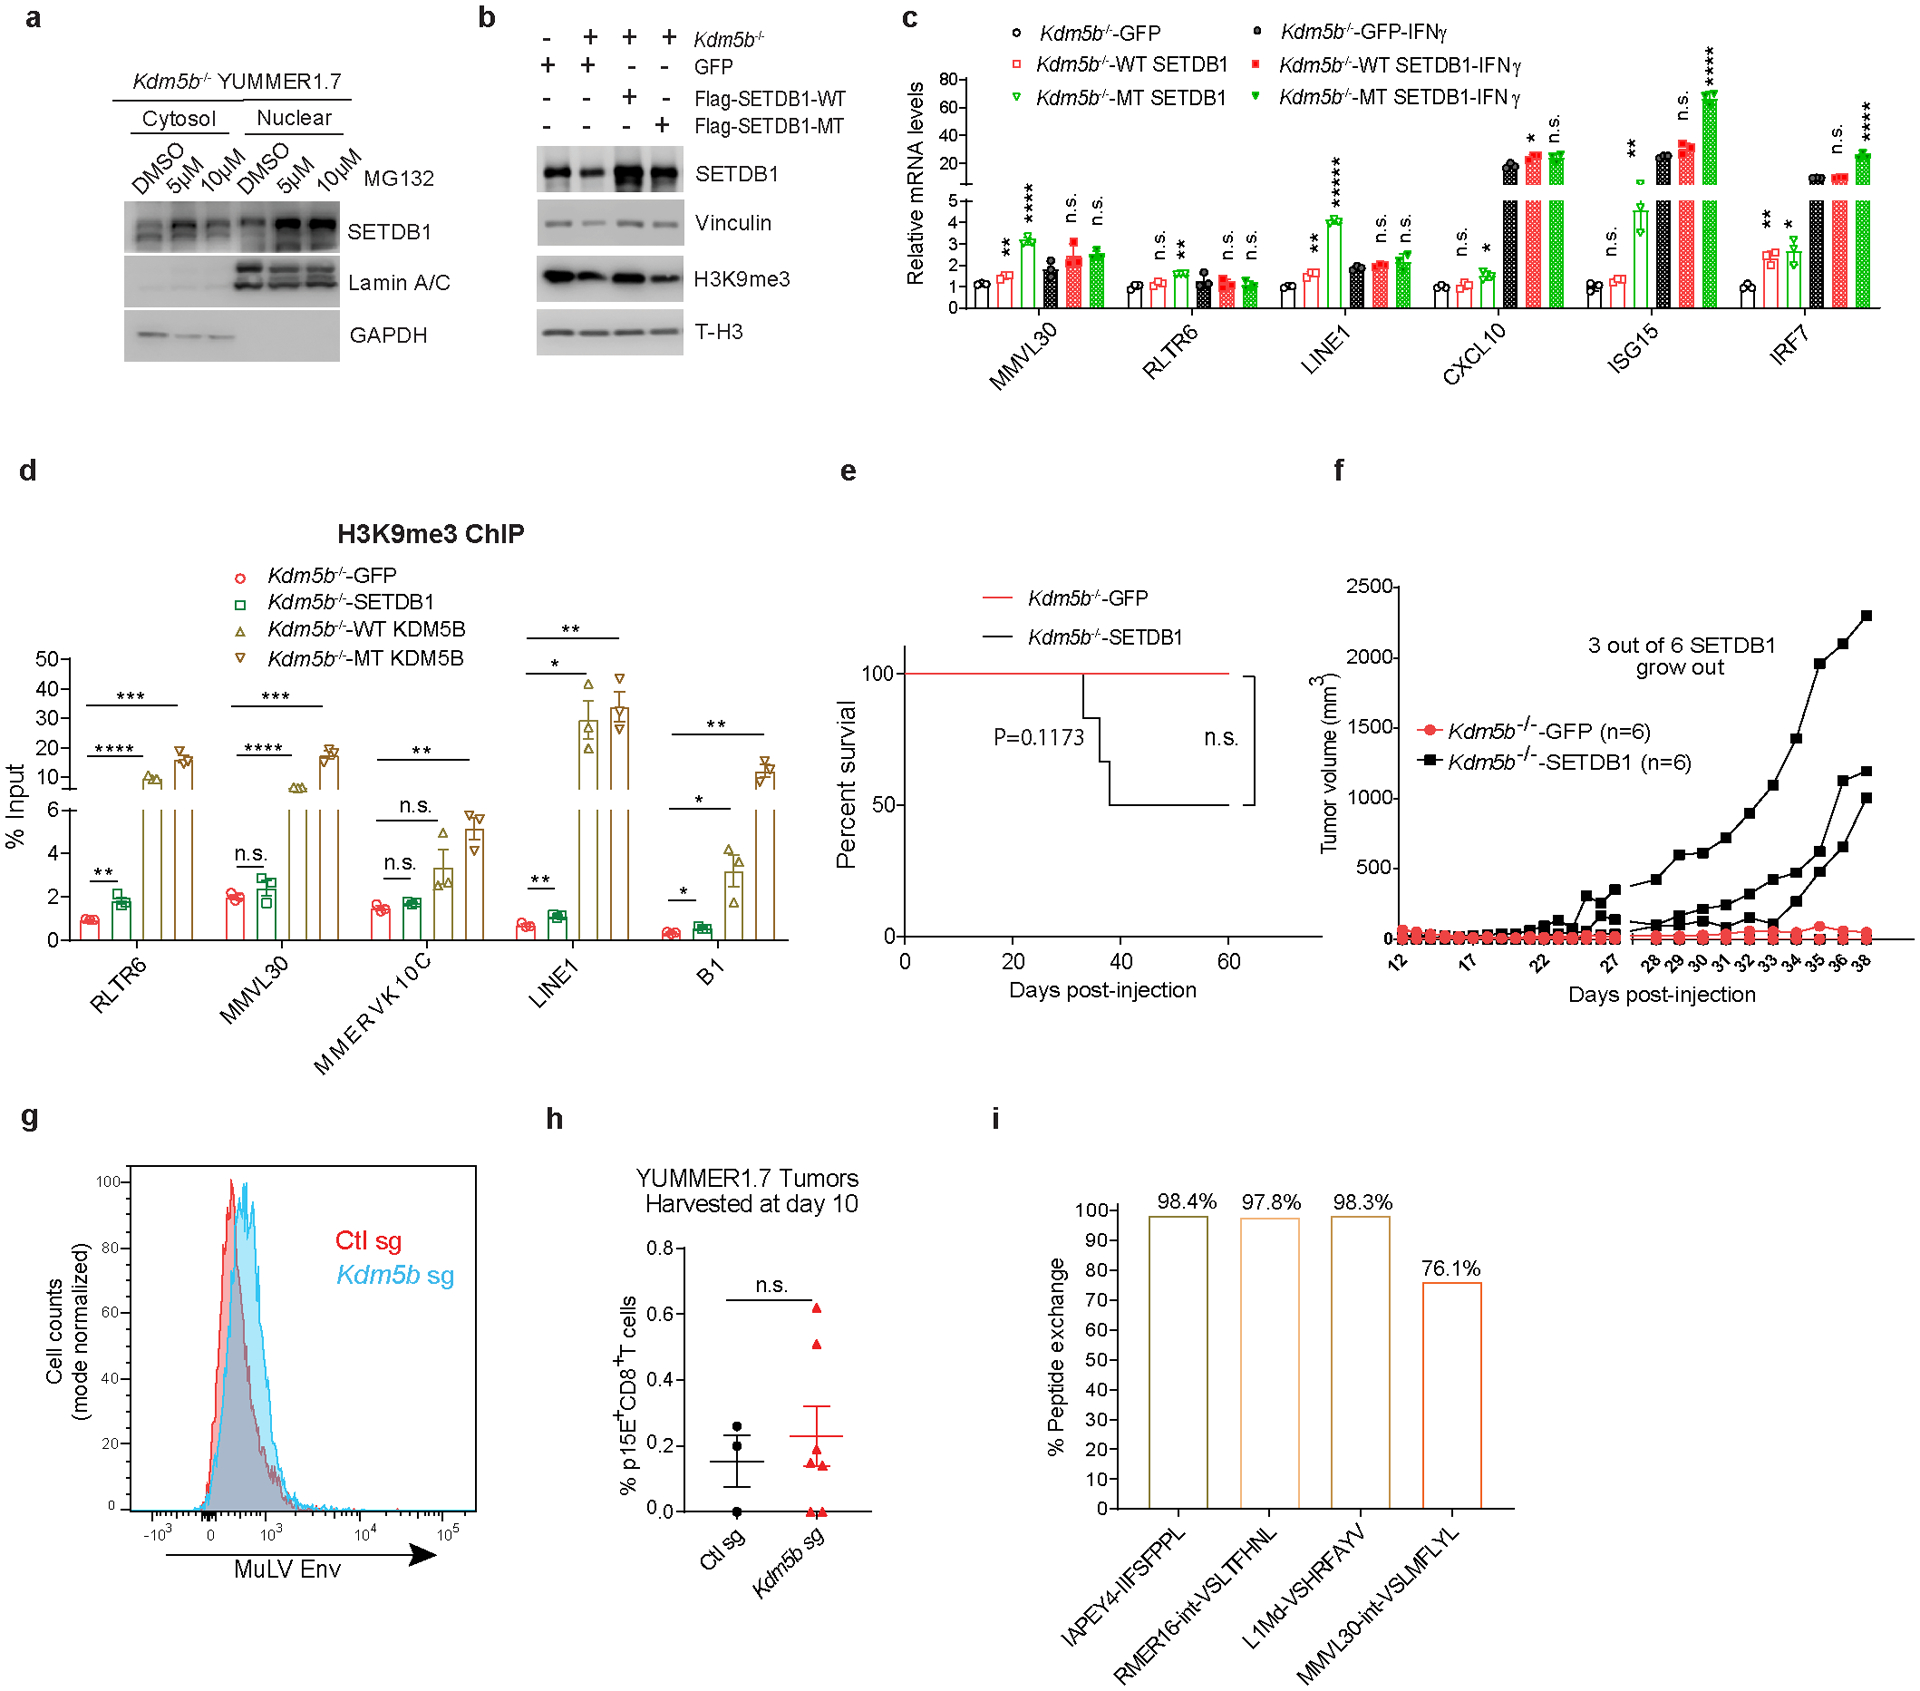
a, Western blot analyses of SETDB1 in cytosolic and nuclear extracts from Kdm5b−/− YUMMER1.7 cells treated with DMSO, 5 μM or 10 μM proteasome inhibitor MG132 for 21 h. For gel source data, see Supplementary Fig. 1. b, Western blot analyses of YUMMER1.7 cells with GFP, Kdm5b−/− YUMMER.17 cells with GFP, WT SETDB1, or MT SETDB1. For gel source data, see Supplementary Fig. 1. c, RT-qPCR analyses of ERVs and ISGs in Kdm5b−/− YUMMER1.7 cells with GFP, WT SETDB1, or MT SETDB1, in the absence or presence of 100 nM IFNγ for 24 h. d, H3K9me3 ChIP-qPCR analyses of Kdm5b−/− YUMMER1.7 cells with GFP, SETDB1, WT KDM5B or MT KDM5B. c-d, Data are means ± SEM. Statistical analysis was done with unpaired two-sided Student’s t test. P values for c are from comparison to the GFP control with the same IFNγ treatment status. n.s. not significant; *p<0.05; **p<0.01; ***p<0.001 and ****p<0.0001. e,f, Kaplan–Meier survival curves (e) and spider plots of tumor growth (f) of C57BL/6 mice injected with Kdm5b−/− YUMMER1.7 cells with GFP (n=6) or SETDB1 (n=6). P values were determined using the log-rank test, n.s. not significant. g, Flow cytometry analysis for MuLV envelope protein (Env) in YUMMER1.7 cells with Ctl sg or Kdm5b sg. h, Quantification of flow cytometry analysis for P15E+CD8+ T cells in YUMMER1.7 tumors with Ctl sg (n=3) or Kdm5b sg (n=7). Data are means ± SEM. Statistical analysis was done with unpaired two-sided Student’s t test. n.s. not significant. i, Quantification showing the percentage of retroelement encoded peptides that were exchanged onto H2-Kb in vitro.
Extended Data Figure 9. Knockdown of KDM5B in human melanoma cells induces ISGs and ERVs through RIG-I and MAVS.
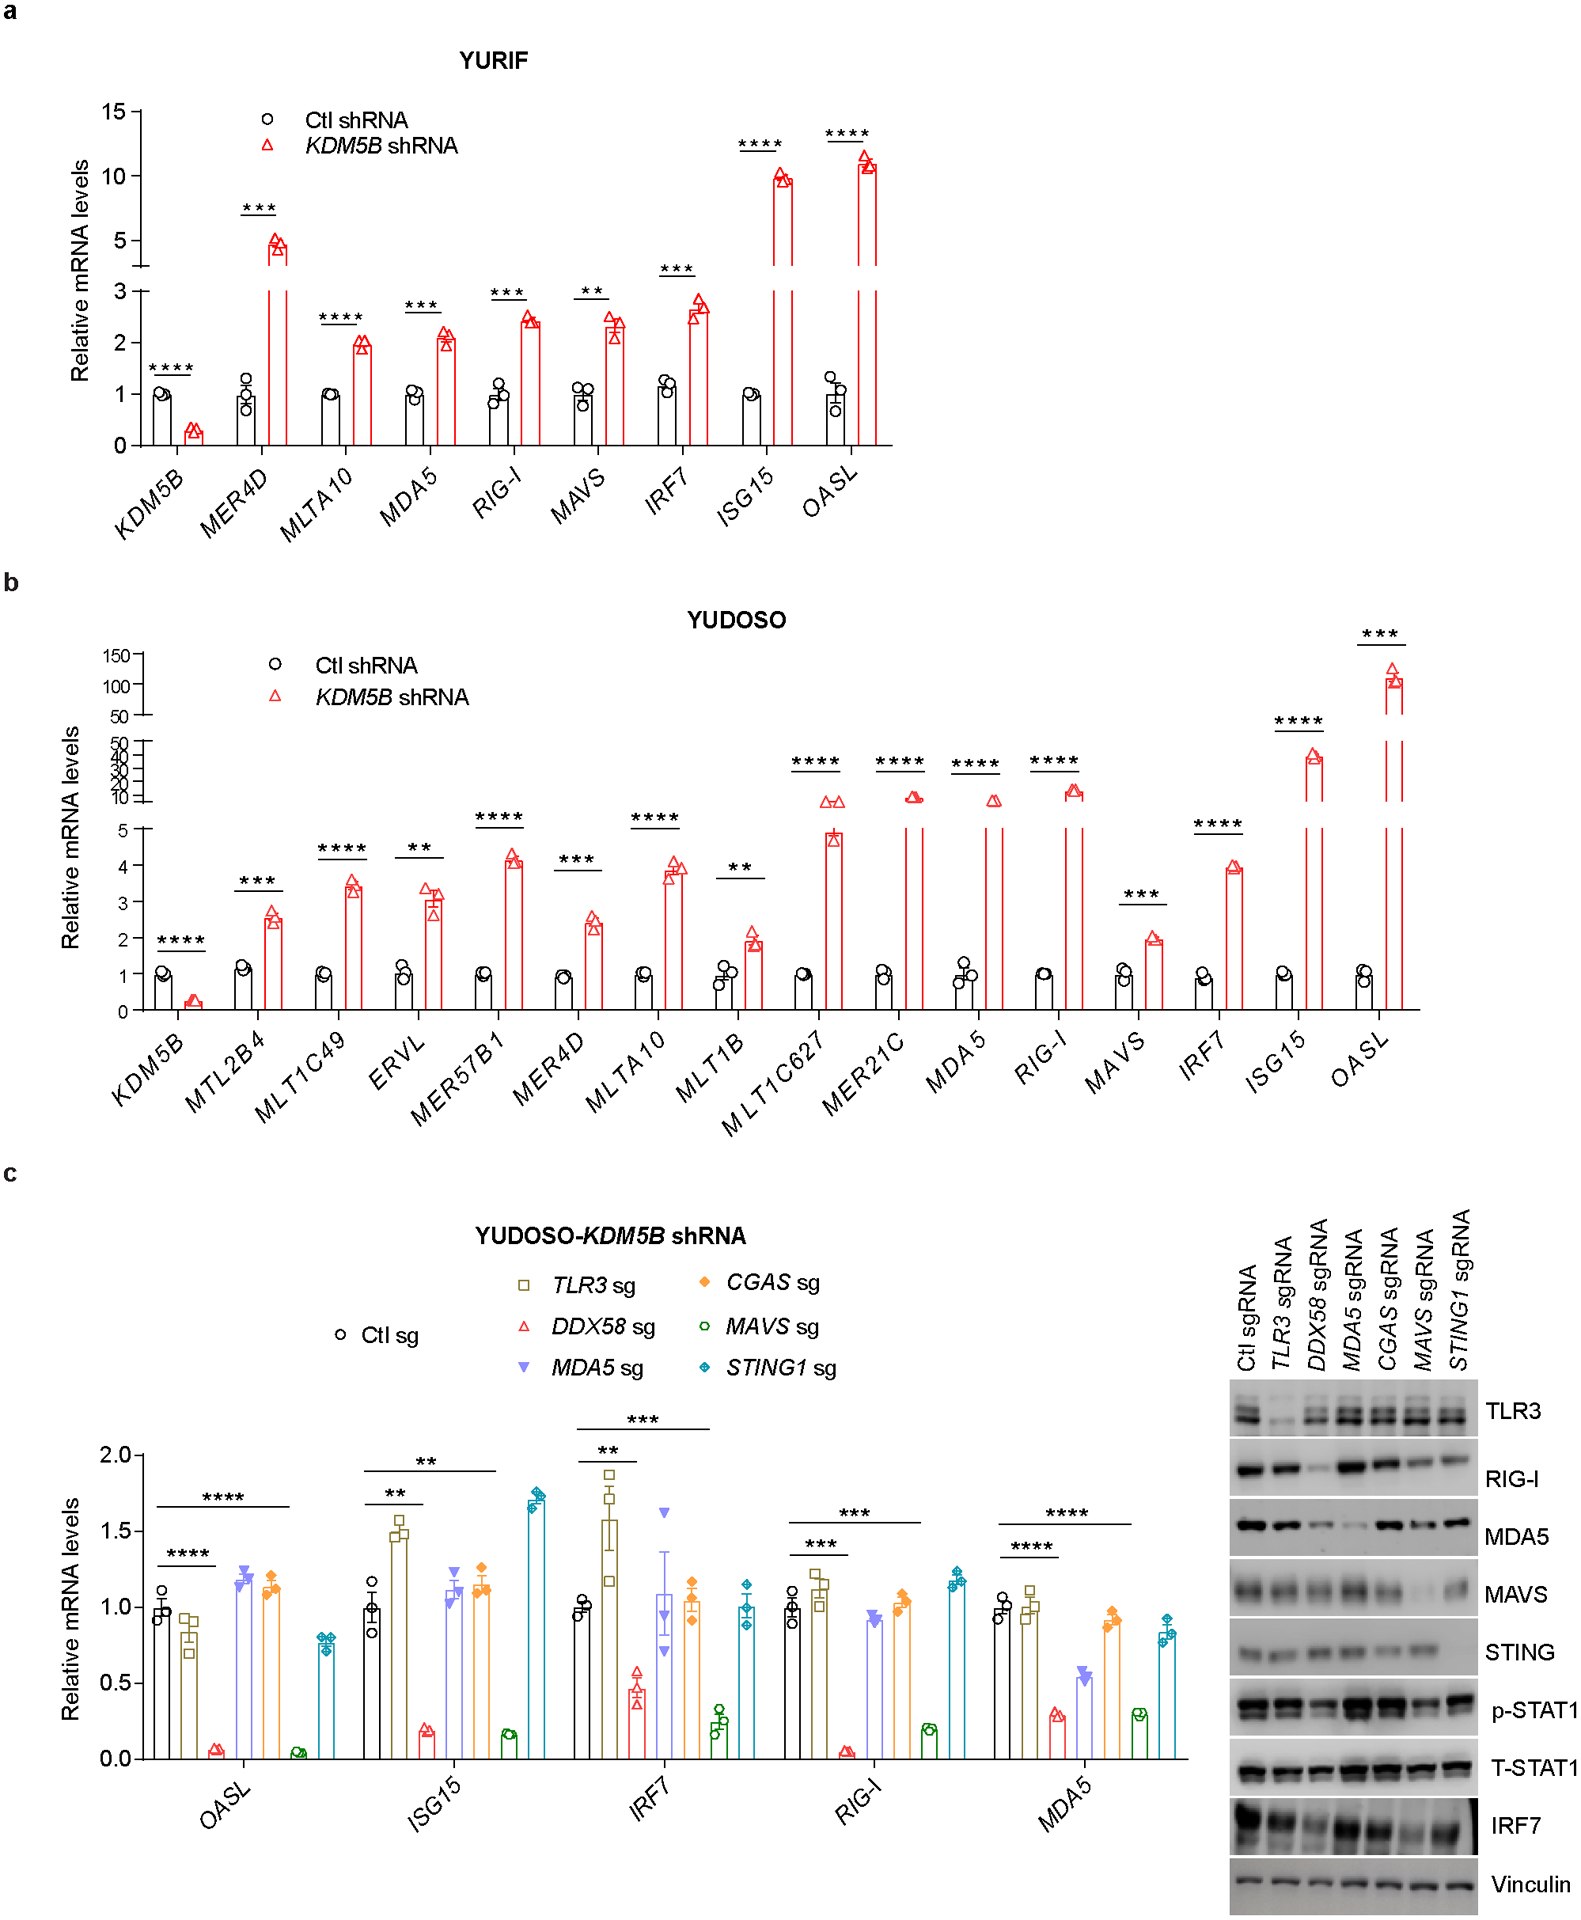
a,b, RT-qPCR analyses of ERVs and ISGs in YURIF (a) or YUDOSO (b) with Ctl or KDM5B shRNA. c, RT-qPCR analyses of ISGs (left) and western blot analyses of DNA and RNA sensors and the type I IFN pathway (right) in YUDOSO human melanoma cells with KDM5B shRNA and Ctl sg, TLR3 sg, RIG-I (DDX58) sg, MDA5 sg, CGAS sg, MAVS sg, or STING1 sg. For gel source data, see Supplementary Fig. 1. Data are means ± SEM. Statistical analysis was done with unpaired two-sided Student’s t test. **p<0.01, ***p<0.001 and ****p<0.0001.
Extended Data Figure 10. Correlation analysis of human ERVs with KDM5B expression and selected epigenetic regulators with patient response to anti-PD-1 treatment, and the working model summarizing the mechanistic findings.
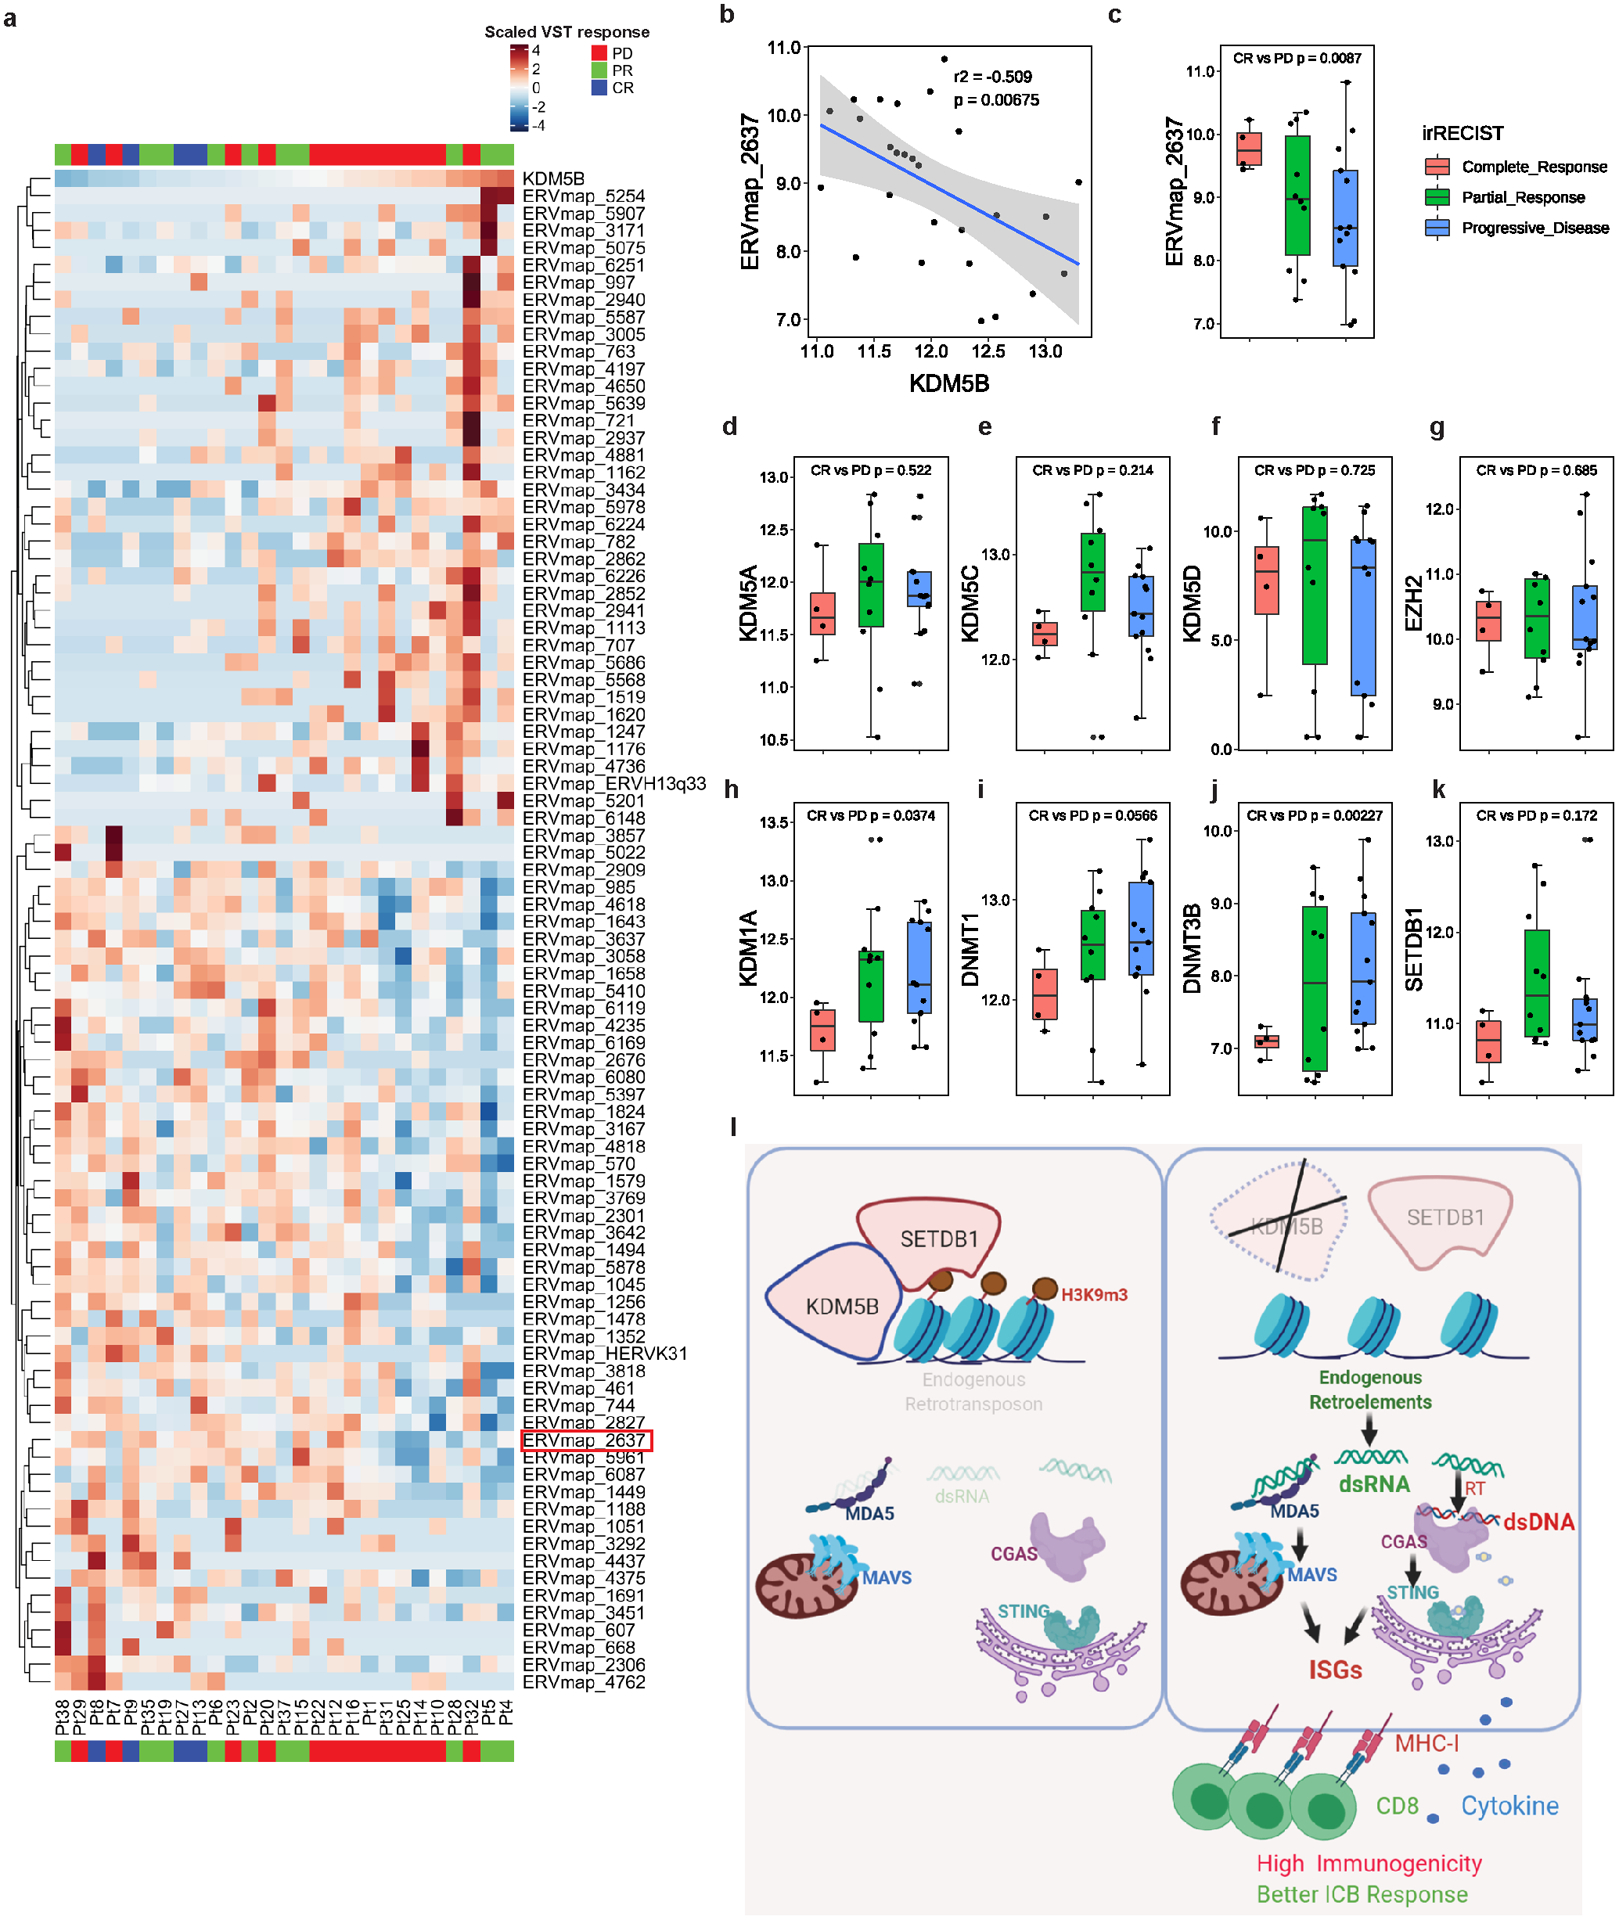
a, Heatmap showing highly differential expressed human ERVs in patient biopsies prior to anti-PD-1 treatment. Samples were ranked by KDM5B expression, with patient responses to anti-PD-1 treatment annotated (PD, progressive disease; PR, partial response; CR, complete response). b, ERVmap_2637 expression is inversely correlated with KDM5B expression in patient cohort described in panel a. Gray zone represents 95% confidence interval for the linear model prediction. c-k, Box plot showing expression of ERVmap_2637 (c), KDM5A (d), KDM5C (e), KDM5D (f), EZH2 (g), KDM1A (h), DNMT1 (i), DNMT3B (j) and SETDB1 (k) in patient cohort described in panel a. Statistical analysis was done with unpaired two-sided Student’s t test. l, The working model showing that KDM5B suppresses anti-tumor responses by recruiting SETDB1 to inhibit endogenous retroelements and type I interferon response. This panel is created with BioRender.com.
Supplementary Material
Acknowledgements:
We thank members of the Yan, Bosenberg, and Iwasaki laboratories for their helpful discussion and support. We thank Dr. Jeffrey J. Ishizuka for helpful discussions. We thank Dr. Ruth Halaban for providing the human melanoma cell lines used in this study. We thank Dr. Qian Xiao for help with some FACS analysis. We thank Dr. Frank J. Rauscher, III from Wistar Institute for providing pCMV.Flag-SETDB1 (WT and catalytically inactive mutant) plasmids. We thank Dr. Mei Zhong for performing the sequencing at Yale Stem Cell Center Genomics Core facility, which was supported by the Connecticut Regenerative Medicine Research Fund and the Li Ka Shing Foundation. We thank Yale Center for Genome Analysis for performing part of the Illumina sequencing. We thank Comparative Pathology Research Core for histology service and Amos Brooks at Yale Pathology Tissue Services for histology and immunohistochemistry service.
These studies were supported in part by grants from the NIH Yale SPORE in Skin Cancer, NCI P50 CA121974 (to M.W.B., H.M.K., M.S. and Q.Y.), P01 CA128814 (to M.W.B.), R01 CA237586 (to Q.Y.), R01 CA227473 and R01 CA216846 (to H.M.K.), Department of Defense W81XWH-13-1-0235 (to Q.Y.) and W81XWH-16-1-0306 and W81XWH-20-1-0360 (to S-M.Z.), a pilot grant from Yale Cancer Center and NCI P30 CA016359 (M.W.B., Q.Y. and A.I.), the Melanoma Research Foundation (to M.W.B. and Q.Y.), the Lung Cancer Research Foundation-LUNGevity and Melanoma Research Alliance Award #308721 (to L.B.J.), and Melanoma Research Alliance Young Investigator Award (to K.R.M.B.).
Footnotes
Competing interests: The authors declare no competing interests.
Code availability: Custom codes have been deposited in GitHub https://github.com/wesleylcai/zhang_nature_2021.
Data availability:
All epigenomic sequencing data of this study have been deposited in the Gene Expression Omnibus database under the accession number GSE161065. Source data are provided with this paper.
References
- 1.Chen DS & Mellman I Elements of cancer immunity and the cancer-immune set point. Nature 541, 321–330 (2017). [DOI] [PubMed] [Google Scholar]
- 2.Cao J & Yan Q Cancer Epigenetics, Tumor Immunity, and Immunotherapy. Trends Cancer 6, 580–592 (2020). [DOI] [PMC free article] [PubMed] [Google Scholar]
- 3.Topalian SL, Drake CG & Pardoll DM Immune checkpoint blockade: a common denominator approach to cancer therapy. Cancer Cell 27, 450–461 (2015). [DOI] [PMC free article] [PubMed] [Google Scholar]
- 4.Topalian SL et al. Safety, activity, and immune correlates of anti-PD-1 antibody in cancer. N Engl J Med 366, 2443–2454 (2012). [DOI] [PMC free article] [PubMed] [Google Scholar]
- 5.Hugo W et al. Genomic and Transcriptomic Features of Response to Anti-PD-1 Therapy in Metastatic Melanoma. Cell 165, 35–44 (2016). [DOI] [PMC free article] [PubMed] [Google Scholar]
- 6.Sharma P, Hu-Lieskovan S, Wargo JA & Ribas A Primary, Adaptive, and Acquired Resistance to Cancer Immunotherapy. Cell 168, 707–723 (2017). [DOI] [PMC free article] [PubMed] [Google Scholar]
- 7.Ribas A & Wolchok JD Cancer immunotherapy using checkpoint blockade. Science 359, 1350–1355 (2018). [DOI] [PMC free article] [PubMed] [Google Scholar]
- 8.Chiappinelli KB et al. Inhibiting DNA Methylation Causes an Interferon Response in Cancer via dsRNA Including Endogenous Retroviruses. Cell 162, 974–986 (2015). [DOI] [PMC free article] [PubMed] [Google Scholar]
- 9.Roulois D et al. DNA-Demethylating Agents Target Colorectal Cancer Cells by Inducing Viral Mimicry by Endogenous Transcripts. Cell 162, 961–973 (2015). [DOI] [PMC free article] [PubMed] [Google Scholar]
- 10.Sheng W et al. LSD1 Ablation Stimulates Anti-tumor Immunity and Enables Checkpoint Blockade. Cell 174, 549–563 e519 (2018). [DOI] [PMC free article] [PubMed] [Google Scholar]
- 11.Pan D et al. A major chromatin regulator determines resistance of tumor cells to T cell-mediated killing. Science 359, 770–775 (2018). [DOI] [PMC free article] [PubMed] [Google Scholar]
- 12.Ishizuka JJ et al. Loss of ADAR1 in tumours overcomes resistance to immune checkpoint blockade. Nature 565, 43–48 (2019). [DOI] [PMC free article] [PubMed] [Google Scholar]
- 13.Roesch A et al. A temporarily distinct subpopulation of slow-cycling melanoma cells is required for continuous tumor growth. Cell 141, 583–594 (2010). [DOI] [PMC free article] [PubMed] [Google Scholar]
- 14.Roesch A et al. Overcoming intrinsic multidrug resistance in melanoma by blocking the mitochondrial respiratory chain of slow-cycling JARID1B(high) cells. Cancer Cell 23, 811–825 (2013). [DOI] [PMC free article] [PubMed] [Google Scholar]
- 15.Liu X et al. KDM5B Promotes Drug Resistance by Regulating Melanoma-Propagating Cell Subpopulations. Mol Cancer Ther 18, 706–717 (2019). [DOI] [PMC free article] [PubMed] [Google Scholar]
- 16.Kearney CJ et al. Tumor immune evasion arises through loss of TNF sensitivity. Sci Immunol 3 (2018). [DOI] [PubMed] [Google Scholar]
- 17.Trujillo JA, Sweis RF, Bao R & Luke JJ T Cell-Inflamed versus Non-T Cell-Inflamed Tumors: A Conceptual Framework for Cancer Immunotherapy Drug Development and Combination Therapy Selection. Cancer Immunol Res 6, 990–1000 (2018). [DOI] [PMC free article] [PubMed] [Google Scholar]
- 18.Wang J et al. UV-induced somatic mutations elicit a functional T cell response in the YUMMER1.7 mouse melanoma model. Pigment Cell Melanoma Res 30, 428–435 (2017). [DOI] [PMC free article] [PubMed] [Google Scholar]
- 19.Held MA et al. Characterization of melanoma cells capable of propagating tumors from a single cell. Cancer Res 70, 388–397 (2010). [DOI] [PMC free article] [PubMed] [Google Scholar]
- 20.Kalbasi A et al. Uncoupling interferon signaling and antigen presentation to overcome immunotherapy resistance due to JAK1 loss in melanoma. Sci Transl Med 12 (2020). [DOI] [PMC free article] [PubMed] [Google Scholar]
- 21.King DP & Jones PP Induction of Ia and H-2 antigens on a macrophage cell line by immune interferon. J Immunol 131, 315–318 (1983). [PubMed] [Google Scholar]
- 22.Mu X, Ahmad S & Hur S Endogenous Retroelements and the Host Innate Immune Sensors. Adv Immunol 132, 47–69 (2016). [DOI] [PMC free article] [PubMed] [Google Scholar]
- 23.Ahmad S et al. Breaching Self-Tolerance to Alu Duplex RNA Underlies MDA5-Mediated Inflammation. Cell 172, 797–810 e713 (2018). [DOI] [PMC free article] [PubMed] [Google Scholar]
- 24.Mehdipour P et al. Epigenetic therapy induces transcription of inverted SINEs and ADAR1 dependency. Nature 588, 169–173 (2020). [DOI] [PubMed] [Google Scholar]
- 25.Kong Y et al. Transposable element expression in tumors is associated with immune infiltration and increased antigenicity. Nat Commun 10, 5228 (2019). [DOI] [PMC free article] [PubMed] [Google Scholar]
- 26.Ye X et al. Endogenous retroviral proteins provide an immunodominant but not requisite antigen in a murine immunotherapy tumor model. Oncoimmunology 9, 1758602 (2020). [DOI] [PMC free article] [PubMed] [Google Scholar]
- 27.Cao J et al. Histone demethylase RBP2 is critical for breast cancer progression and metastasis. Cell Rep 6, 868–877 (2014). [DOI] [PMC free article] [PubMed] [Google Scholar]
- 28.Horton JR et al. Structural Basis for KDM5A Histone Lysine Demethylase Inhibition by Diverse Compounds. Cell Chem Biol 23, 769–781 (2016). [DOI] [PMC free article] [PubMed] [Google Scholar]
- 29.Griffin GK et al. Epigenetic silencing by SETDB1 suppresses tumour intrinsic immunogenicity. Nature (2021). [DOI] [PMC free article] [PubMed] [Google Scholar]
- 30.Yin M et al. Potent BRD4 inhibitor suppresses cancer cell-macrophage interaction. Nat Commun 11, 1833 (2020). [DOI] [PMC free article] [PubMed] [Google Scholar]
- 31.Kluger HM et al. PD-L1 Studies Across Tumor Types, Its Differential Expression and Predictive Value in Patients Treated with Immune Checkpoint Inhibitors. Clin Cancer Res 23, 4270–4279 (2017). [DOI] [PMC free article] [PubMed] [Google Scholar]
- 32.Kluger HM et al. Characterization of PD-L1 Expression and Associated T-cell Infiltrates in Metastatic Melanoma Samples from Variable Anatomic Sites. Clin Cancer Res 21, 3052–3060 (2015). [DOI] [PMC free article] [PubMed] [Google Scholar]
- 33.Blenman KRM & Bosenberg MW Immune Cell and Cell Cluster Phenotyping, Quantitation, and Visualization Using In Silico Multiplexed Images and Tissue Cytometry. Cytometry A 95, 399–410 (2019). [DOI] [PMC free article] [PubMed] [Google Scholar]
- 34.Treger RS et al. Human APOBEC3G Prevents Emergence of Infectious Endogenous Retrovirus in Mice. J Virol 93 (2019). [DOI] [PMC free article] [PubMed] [Google Scholar]
- 35.Bolger AM, Lohse M & Usadel B Trimmomatic: a flexible trimmer for Illumina sequence data. Bioinformatics 30, 2114–2120 (2014). [DOI] [PMC free article] [PubMed] [Google Scholar]
- 36.Dobin A et al. STAR: ultrafast universal RNA-seq aligner. Bioinformatics 29, 15–21 (2013). [DOI] [PMC free article] [PubMed] [Google Scholar]
- 37.Karolchik D et al. The UCSC Table Browser data retrieval tool. Nucleic Acids Res 32, D493–496 (2004). [DOI] [PMC free article] [PubMed] [Google Scholar]
- 38.Liao Y, Smyth GK & Shi W featureCounts: an efficient general purpose program for assigning sequence reads to genomic features. Bioinformatics 30, 923–930 (2014). [DOI] [PubMed] [Google Scholar]
- 39.Love MI, Huber W & Anders S Moderated estimation of fold change and dispersion for RNA-seq data with DESeq2. Genome Biol 15, 550 (2014). [DOI] [PMC free article] [PubMed] [Google Scholar]
- 40.Storer J, Hubley R, Rosen J, Wheeler TJ & Smit AF The Dfam community resource of transposable element families, sequence models, and genome annotations. Mob DNA 12, 2 (2021). [DOI] [PMC free article] [PubMed] [Google Scholar]
- 41.Pertea M et al. StringTie enables improved reconstruction of a transcriptome from RNA-seq reads. Nat Biotechnol 33, 290–295 (2015). [DOI] [PMC free article] [PubMed] [Google Scholar]
- 42.Tjeldnes H & Labun K ORFik: Open Reading Frames in Genomics, <https://github.com/Roleren/ORFik> (2021).
- 43.Andreatta M & Nielsen M Gapped sequence alignment using artificial neural networks: application to the MHC class I system. Bioinformatics 32, 511–517 (2016). [DOI] [PMC free article] [PubMed] [Google Scholar]
- 44.Nielsen M et al. Reliable prediction of T-cell epitopes using neural networks with novel sequence representations. Protein Sci 12, 1007–1017 (2003). [DOI] [PMC free article] [PubMed] [Google Scholar]
- 45.Krueger F Trim Galore. (2019).
- 46.Langmead B & Salzberg SL Fast gapped-read alignment with Bowtie 2. Nat Methods 9, 357–359 (2012). [DOI] [PMC free article] [PubMed] [Google Scholar]
- 47.Li H et al. The Sequence Alignment/Map format and SAMtools. Bioinformatics 25, 2078–2079 (2009). [DOI] [PMC free article] [PubMed] [Google Scholar]
- 48.Zhang Y et al. Model-based analysis of ChIP-Seq (MACS). Genome Biol 9, R137 (2008). [DOI] [PMC free article] [PubMed] [Google Scholar]
- 49.Ramirez F et al. deepTools2: a next generation web server for deep-sequencing data analysis. Nucleic Acids Res 44, W160–165 (2016). [DOI] [PMC free article] [PubMed] [Google Scholar]
- 50.Gu Z, Eils R & Schlesner M Complex heatmaps reveal patterns and correlations in multidimensional genomic data. Bioinformatics 32, 2847–2849 (2016). [DOI] [PubMed] [Google Scholar]
- 51.Pohl A & Beato M bwtool: a tool for bigWig files. Bioinformatics 30, 1618–1619 (2014). [DOI] [PMC free article] [PubMed] [Google Scholar]
- 52.Heinz S et al. Simple combinations of lineage-determining transcription factors prime cis-regulatory elements required for macrophage and B cell identities. Mol Cell 38, 576–589 (2010). [DOI] [PMC free article] [PubMed] [Google Scholar]
- 53.Wei J et al. Genome-wide CRISPR Screens Reveal Host Factors Critical for SARS-CoV-2 Infection. Cell 184, 76–91 e13 (2021). [DOI] [PMC free article] [PubMed] [Google Scholar]
- 54.Tokuyama M et al. ERVmap analysis reveals genome-wide transcription of human endogenous retroviruses. Proc Natl Acad Sci U S A 115, 12565–12572 (2018). [DOI] [PMC free article] [PubMed] [Google Scholar]
- 55.Patro R, Duggal G, Love MI, Irizarry RA & Kingsford C Salmon provides fast and bias-aware quantification of transcript expression. Nat Methods 14, 417–419 (2017). [DOI] [PMC free article] [PubMed] [Google Scholar]
- 56.Canadas I et al. Tumor innate immunity primed by specific interferon-stimulated endogenous retroviruses. Nat Med 24, 1143–1150 (2018). [DOI] [PMC free article] [PubMed] [Google Scholar]
- 57.Herquel B et al. Trim24-repressed VL30 retrotransposons regulate gene expression by producing noncoding RNA. Nat Struct Mol Biol 20, 339–346 (2013). [DOI] [PubMed] [Google Scholar]
- 58.West AP et al. Mitochondrial DNA stress primes the antiviral innate immune response. Nature 520, 553–557 (2015). [DOI] [PMC free article] [PubMed] [Google Scholar]
Associated Data
This section collects any data citations, data availability statements, or supplementary materials included in this article.
Supplementary Materials
Data Availability Statement
All epigenomic sequencing data of this study have been deposited in the Gene Expression Omnibus database under the accession number GSE161065. Source data are provided with this paper.


